 | 23 Aug 2023
Recent improvements in the E-OBS gridded data set for daily mean wind speed over Europe in the period 1980–2021
Jouke H. S. de Baar
Linh Nhat Luu
Gerard van der Schrier
Else J. M. van den Besselaar
Irene Garcia-Marti
In this work, we present the most recent updates in the E-OBS gridded data set for daily mean wind speed over Europe. The data set is provided as an ensemble of 20 equally likely realisations. The main improvements of this data set are the use of forward selection linear regression for the monthly background field, as well as a method to ensure the reliability of the ensemble dispersion. In addition, we make a preliminary study into possible causes of the observed terrestrial wind stilling effect, such as local changes in surface roughness length.
- Article
(1709 KB) - Full-text XML
- BibTeX
- EndNote


Providing gridded climate data sets is part of climate data services. Gridded climate data sets are popular products in climate data services because of their ease in handling and their ability to homogeneously cover the complete domain. Such gridded data sets can be exploited in studies into climate change mitigation and adaptation. For Europe, E-OBS provides a gridded data set for a family of variables (van den Besselaar et al., 2011; Cornes et al., 2018); a recent addition to the E-OBS family is the present gridded data set for daily mean wind speed (de Baar et al., 2023). The E-OBS in-situ based gridded data set is part of the Copernicus Climate Change Services and is based on a large number of European stations, mostly from National Meteorological and Hydrological Services. Currently, the variables mean temperature, minimum temperature, maximum temperature, precipitation amount, sea level pressure, surface shortwave downwelling radiation, relative humidity and wind speed can be downloaded from https://cds.climate.copernicus.eu/ (last access: 14 August 2023) or from https://surfobs.climate.copernicus.eu/ (last access: 14 August 2023).
For this gridded data set, validated in situ station data for h=10 m wind speed is used which is supplied by the European National Meteorological Services (NMHSs) and other data holding institutes to the European Climate Assessment & Dataset (ECA&D) (Klein Tank et al., 2002; Klok and Klein Tank, 2009; ECA&D Team, 2012). For the areas in Europe where these data are missing, we use the in situ daily mean wind speed compiled by the Global Summary Of the Day (GSOD) (Smith et al., 2011).
Inspired by Brinckmann et al. (2016), we use a set of covariates as predictors for the daily mean wind speed: (1) latitude and longitude coordinates (from the ECA&D geographical extent); (2) multi-year ERA5 monthly average 800 hPa wind speed (Hersbach et al., 2020); (3) terrain altitude, slope and positioning index (from USGS GTOPO30); (4) distance to coast; and (5) terrain roughness length (obtained from Copernicus Climate Data Store). Because wind speed is a spatially high-resolution variable, we have maintained the spatial representation of the covariates and only used piece-wise linear downsampling to match the E-OBS grid resolution.
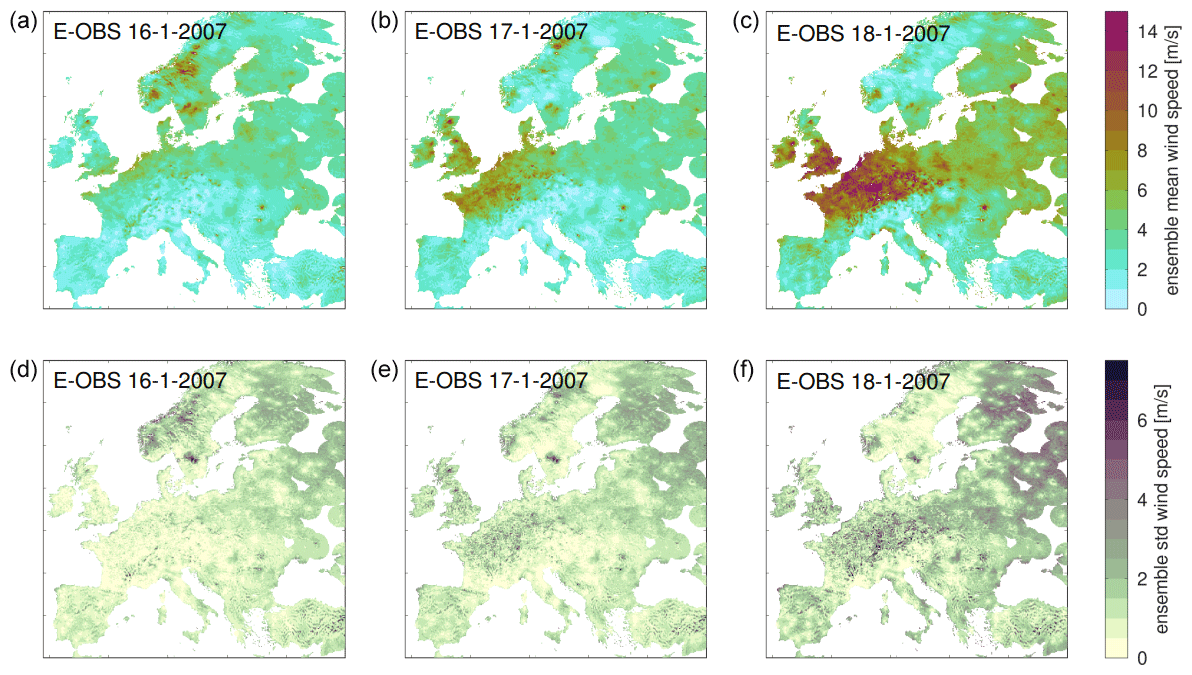
Figure 1Example E-OBS grid for daily mean wind speed, showing the passing of storm “Kyrill” (2007) over Europe. The subplots show (a–c) ensemble mean and (d–f) ensemble standard deviation for 16–18 January 2007.
A detailed description of the methodology is provided in de Baar et al. (2023), here we provide a short description. We consider the log-transformed daily mean wind speed. Our procedure is to first compute the monthly mean station values, and then exploit the covariates to learn a background field for each year and month. For the background field we allow for higher-order terms and interaction terms of the covariates – as an improvement over more standard methods. Because such a model contains many potential basis functions and coefficients and is therefore susceptible to over-fitting, we use forward selection linear regression (James et al., 2013) to select the most important basis function. Instead of using the root mean squared (rms) residual as a selection criterion, we use the 10-fold cross-validation rms error (James et al., 2013), which is a further safe-guard against over-fitting of the monthly background field.
After finding the background fields for each year and month, we use gaussian process regression (Wikle and Berliner, 2007) to regress the daily station anomalies. We use an exponentially decaying covariance function, with a relative measurement uncertainty level (“nugget”) of 1 %. We use a maximum likelihood estimate to tune the correlation length of the covariance function, and use a search range (i.e. mask) of 150 km to the nearest station. The gridded anomaly is then added to the backround grid.
We provide the gridded data set as an ensemble of 20 equally likely realisations as a means to quantify the uncertainty. The initial ensemble is created through random bootstrapping (James et al., 2013) of the monthly background grid. This implies that each ensemble member of the background grid can have different basis functions and coefficients. Then, we make another improvement by applying the newly developed Ensemble Dispersion Improvement auto-Tune (EDIT) to adjust the ensemble spread during post-processing to reflect realistic uncertainty levels in the data set (de Baar et al., 2022, 2023).
Figure 1 illustrates the E-OBS gridded data set for daily mean wind speed, for storm “Kyrill” (2007) passing over Europe. In Fig. 1, the top row shows the ensemble mean, while the bottom row shows the ensemble standard deviation. It can be seen that the uncertainty is larger in areas with high mean wind speeds, areas with low station density (like Eastern Europe) and areas with complicated topography (like the coast of Norway).
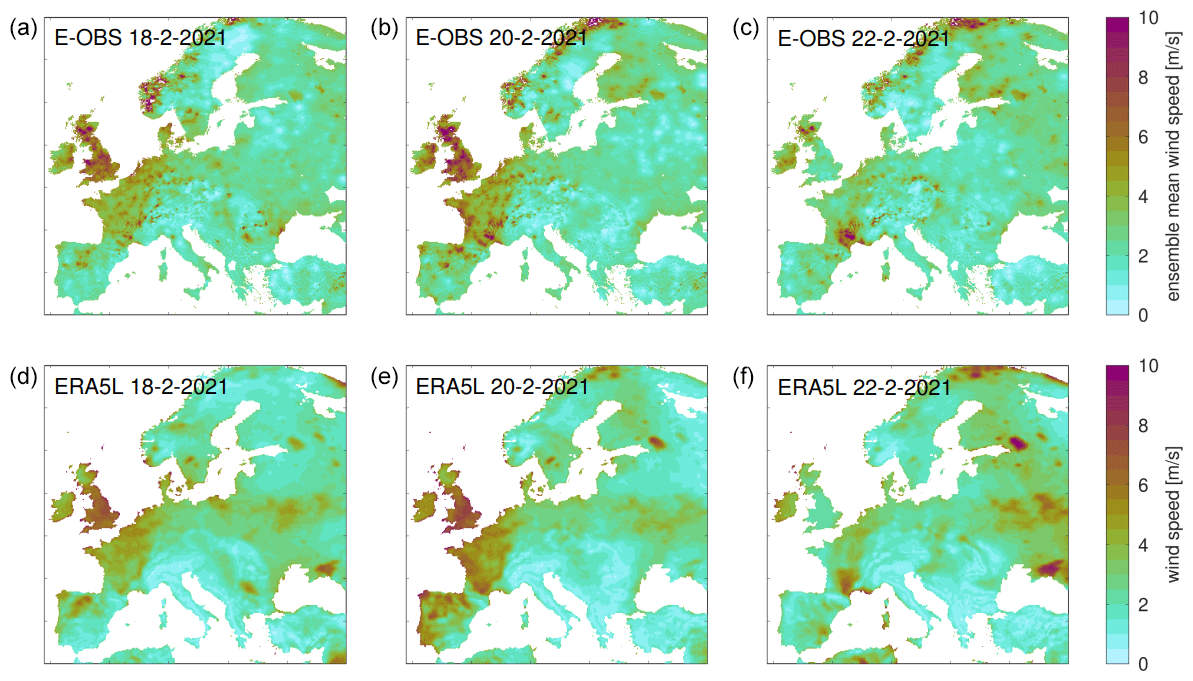
Figure 2Comparison of E-OBS and ERA5-Land grids for daily mean wind speed, showing the passing of storm “Karim” (2021) over Europe. The subplots show (a–c) E-OBS and (d–f) ERA5-Land for 18–20–22 February 2021. The ERA5-Land data for creating the bottom row figures was downloaded from the Copernicus Climate Change Service (C3S) Climate Data Store (Hersbach et al., 2020; Muñoz-Sabater et al., 2021).
4.1 Initial comparison between E-OBS and ERA5-Land
Figure 2 shows a comparison of the ensemble mean E-OBS grid and the daily mean ERA5-Land (Muñoz-Sabater et al., 2021) grid during storm “Karim” (2021). It should be noted that ERA5-Land is not assimilated for wind speed, although wind speed does enter in an indirect way because ERA5-Land is forced by the atmospheric component of ERA5 which was assimilated by information from boundary layer, e.g., ground-based wind profile or air balloon (Muñoz-Sabater et al., 2021). Although the general features are quite similar, we note that E-OBS shows more detail (i.e. less smoothness) than ERA5-Land. Also, we see some differences along the coast of Norway and of Portugal. A more detailed comparison between E-OBS and ERA5-Land is provided in de Baar et al. (2023), which confirms that E-OBS preserve the extremes in wind speed a bit better and generally shows more structure in the wind field.
4.2 Towards understanding terrestrial wind stilling
The new E-OBS daily mean wind speed gridded dataset over Europe might be helpful to better understand an interesting and elusive phenomenon: terrestrial wind stilling. According to different studies, the yearly mean wind speed over land has seen a downward trend, in particular in the period 1980–2010 (e.g. Vautard et al., 2010). We extracted the daily mean wind speed during the selected period to better explore this hypothesis. Figure 3a illustrates the reduction in yearly mean wind speed spatially averaged over the area covered by E-OBS, which would be in line with what previous research has identified. However, when this one-dimensional trend is unraveled to the geographic space, we can find some spatial patterns that might not conform with previous findings. Figure 3b shows that the trend depends very much on the location with the strongest decreases in wind speed over Sweden. Recently, this decrease in wind speed over Sweden was also discussed in Minola et al. (2023), and change of surface roughness was mentioned as one of the possible causes.
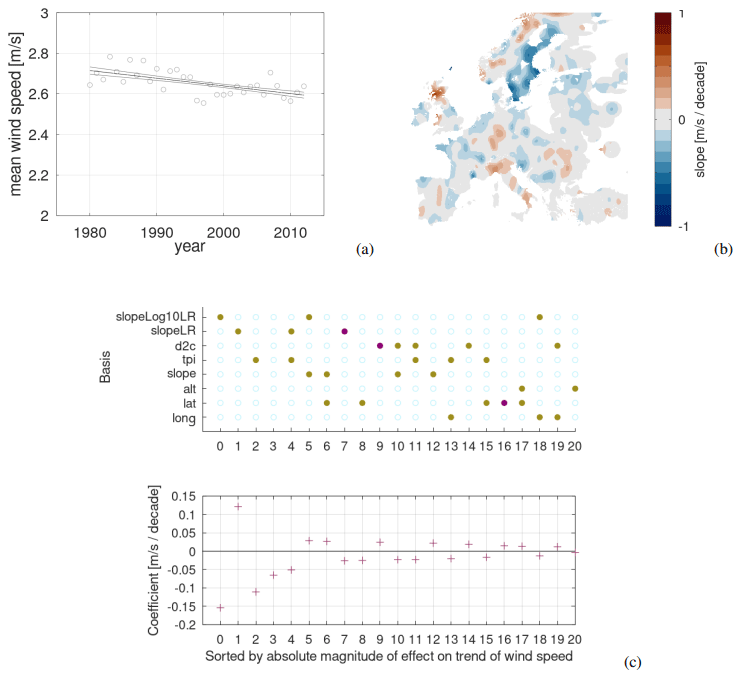
Figure 3Illustration of the wind stilling effect, showing (a) the surface-averaged yearly mean wind speed over Europe, with a slope of m s−1 per decade, (b) the spatially-smoothed local trend in yearly mean wind speed over the full period and (c) forward selection linear regression based on several normalised predictors (lon: longitude, lat: latitude, alt: log altitude, slope: log abs terrain slope, tpi: log abs terrain position index, d2c: sqrt distance to coast, slopeLR: multi-year trend in terrain surface roughness length, slopeLog10LR: multi-year trend in log terrain surface roughness length. In (c), the top image illustrates the basis functions, with orange indicating a first-order contribution and purple indicating a second-order contribution; while the bottom image indicates the respective weights (r2≈0.26).
In order to better understand the cause of this wind stilling effect, we use forward selection linear regression (James et al., 2013) to learn the local wind stilling trend shown in Fig. 3b as a function of local covariates. The resulting model is illustrated in Fig. 3c, where the basis functions (vertical axis) have been ordered from high to low by magnitude of their effect. In the top panel of Fig. 3c we show the basis functions, where the color indicates the power of each basis function during multiplication: open circle indicates power zero, orange circle indicates power one and purple indicates power two. For example, basis function “2” is linear in topographic position index (TPI), while basis function “3” is a constant. A basis function with multiple circles indicates an interaction term. In the bottom panel, we show the corresponding coefficients. We observe an important effect from the local trend in the logarithm of the surface roughness length suggesting land-use changes to drive wind stilling. However, the indicated r2 value is low, indicating that the picture of terrestrial wind stilling is probably more complex and involves many significant terms. Some of these terms might be even higher-order terms or interactions or covariates that were not included in this study. Further investigation is taken up, for example, by Luu et al. (2023).
We have presented a new E-OBS gridded data set for daily mean wind speed. The main improvements are the use of forward selection linear regression to fit a covariate-based background field, as well as EDIT to ensure reliable ensemble dispersion. The study of the terrestrial wind stilling effect provides some initial results, however, more research is required.
The R scripts for E-OBS wind are available from https://doi.org/10.5281/zenodo.8189422 (jdebaar, 2023). The gridded data is available from https://doi.org/10.24381/cds.151d3ec6 under the tab “Download data”, followed by selection “Wind speed” (Copernicus Climate Change Service, Climate Data Store, 2020).
JHSdB: conceptualisation, data acquisition, software, writing. LNL: conceptualisation, writing. GvdS: conceptualisation, data acquisition, writing. EJMvdB: conceptualisation, data acquisition, writing. IGM: conceptualisation, writing.
The contact author has declared that none of the authors has any competing interests.
Publisher's note: Copernicus Publications remains neutral with regard to jurisdictional claims in published maps and institutional affiliations.
This article is part of the special issue “EMS Annual Meeting: European Conference for Applied Meteorology and Climatology 2022”. It is a result of the EMS Annual Meeting: European Conference for Applied Meteorology and Climatology 2022, Bonn, Germany, 4–9 September 2022. The corresponding presentation was part of session OSA3.2: Spatial climatology.
ERA5 data for the p=800 hPa wind speed covariate and ERA5-Land data were downloaded from the Copernicus Climate Change Service (C3S) Climate Data Store (Hersbach et al., 2020; Muñoz-Sabater et al., 2021). We acknowledge the data providers in the ECA&D project (https://www.ecad.eu, last access: 19 August 2023).
This research has been supported by the Copernicus Climate Change Service (grant no. C3S_311a_Lot4).
This paper was edited by Ole Einar Tveito and reviewed by three anonymous referees.
Brinckmann, S., Krähenmann, S., and Bissolli, P., High-resolution daily gridded data sets of air temperature and wind speed for Europe, Earth Syst. Sci. Data, 8, 491–516, https://doi.org/10.5194/essd-8-491-2016, 2016. a
Copernicus Climate Change Service, Climate Data Store: E-OBS daily gridded meteorological data for Europe from 1950 to present derived from in-situ observations, Copernicus Climate Change Service (C3S) Climate Data Store (CDS) [data set], https://doi.org/10.24381/cds.151d3ec6, 2020. a
Cornes, R. C., van der Schrier, G., van den Besselaar, E. J., and Jones, P. D.: An ensemble version of the E‐OBS temperature and precipitation data sets, J. Geophys. Res.-Atmos., 123, 9391–9409, https://doi.org/10.1029/2017JD028200, 2018. a
Crameri, F.: Scientific colour maps, Zenodo [code], https://doi.org/10.5281/zenodo.5501399, 2018.
de Baar, J., de Valk, C., and van der Schrier, G.: Ensemble dispersion improvement auto-tune (EDIT), a generic post processing step for Machine Learning regression results with quantified uncertainty, EMS Annual Meeting 2022, Bonn, Germany, 5–9 September 2022, EMS2022-413, https://doi.org/10.5194/ems2022-413, 2022. a
de Baar, J. H. S., van der Schrier, G., van den Besselaar, E. J. M., Garcia-Marti, I., and de Valk, C.: A new E-OBS gridded data set for daily mean wind speed over Europe, Int. J. Climatol., https://doi.org/10.1002/joc.8191, 2023. a, b, c, d
ECA&D Team: European Climate Assessment & Dataset Algorithm Theoretical Basis Document (ATBD), version 10, Royal Netherlands Meteorological Institute KNMI, De Bilt, the Netherlands, https://cdn.knmi.nl/system/data_center_publications/files/000/067/636/original/ecad_atbd_copy1.pdf?1495620814 (last access: 19 August 2023), 2012. a
Hersbach, H., Bell, B., Berrisford, P., Hirahara, S., Horányi, A., Muñoz-Sabater, J., Nicolas, J., Peubey, C., Radu, R., Schepers, D., Simmons, A., Soci, C., Abdalla, S., Abellan, X., Balsamo, G., Bechtold, P., Biavati, G., Bidlot, J., Bonavita, M., De Chiara, G., Dahlgren, P., Dee, D., Diamantakis, M., Dragani, R., Flemming, J., Forbes, R., Fuentes, M., Geer, A., Haimberger, L., Healy, S., Hogan, R. J., Hólm, E., Janisková, M., Keeley, S., Laloyaux, P., Lopez, P., Lupu, C., Radnoti, G., de Rosnay, P., Rozum, I., Vamborg, F., Villaume, S., and Thépaut, J.-N.: The ERA5 global reanalysis, Q. J. Roy. Meteorol. Soc., 146, 1999–2049, https://doi.org/10.1002/qj.3803, 2020. a, b, c
James, G., Witten, D., Hastie, T., and Tibshirani, R.: An introduction to statistical learning, in: Vol. 112, Springer, New York, p. 18, ISBN 13 978-1461471370, 2013. a, b, c, d
jdebaar: ECA-D/windgrid: E-OBS wind (Version ems2022), Zenodo [code], https://doi.org/10.5281/zenodo.8189422, 2023. a
Klein Tank, A. M. G., Wijngaard, J. B., Können, G. P., Böhm, R., Demarée, G., Gocheva, A., Mileta, M., Pashiardis, S., Hejkrlik, L., Kern-Hansen, C., Heino, R., Bessemoulin, P., Müller-Westermeier, G., Tzanakou, M., Szalai, S., Pálsdóttir, T., Fitzgerald, D., Rubin, S., Capaldo, M., Maugeri, M., Leitass, A., Bukantis, A., Aberfeld, R., van Engelen, A. F. V., Forland, E., Mietus, M., Coelho, F., Mares, C., Razuvaev, V., Nieplova, E., Cegnar, T., Antonio López, J., Dahlström, B., Moberg, A., Kirchhofer, W., Ceylan, A., Pachaliuk, O., Alexander, L. V., and Petrovic, P.: Daily dataset of 20th‐century surface air temperature and precipitation series for the European Climate Assessment, Int. J. Climatol., 22, 1441–1453, https://doi.org/10.1002/joc.773, 2002. a
Klok, E. J. and Klein Tank, A. M. G.: Updated and extended European dataset of daily climate observations, Int. J. Climatol., 29, 1182–1191, https://doi.org/10.1002/joc.1779, 2009. a
Luu, L. N., van Meijgaard, E., Philip, S. Y., Kew, S. F., de Baar, J. H. S., and Stepek, A.: Impact of surface roughness changes on surface wind speed over western Europe: a study with a regional climate model, J. Geophys. Res.-Atmos., 128, e2022JD038426, https://doi.org/10.1029/2022JD038426, 2023. a
Minola, L., Lönn, J., Azorin-Molina, C., Zhou, C., Engström, E., Wern, L., Hellström, S., Zhang, G., Shen, C., Pezzoli, A., and Chen, D.: The contribution of large-scale atmospheric circulation to variations of observed near-surface wind speed across Sweden since 1926, Climatic Change, 176, 54, https://doi.org/10.1007/s10584-023-03525-0, 2023. a
Muñoz-Sabater, J., Dutra, E., Agustí-Panareda, A., Albergel, C., Arduini, G., Balsamo, G., Boussetta, S., Choulga, M., Harrigan, S., Hersbach, H., and Martens, B.: ERA5-Land: A state-of-the-art global reanalysis dataset for land applications, Earth Syst. Sci. Data, 13, 4349–4383, https://doi.org/10.5194/essd-13-4349-2021, 2021. a, b, c, d
Smith, A., Lott, N., and Vose, R.: The integrated surface database: Recent developments and partnerships, B. Am. Meteorol. Soc., 92, 704–708, https://doi.org/10.1175/2011BAMS3015.1, 2011. a
van den Besselaar, E. J., Haylock, M. R., Van der Schrier, G., and Klein Tank, A. M. G.: A European daily high‐resolution observational gridded data set of sea level pressure, J. Geophys. Res.-Atmos., 116, D11110, https://doi.org/10.1029/2010JD015468, 2011. a
Vautard, R., Cattiaux, J., Yiou, P., Thépaut, J. N., and Ciais, P.: Northern Hemisphere atmospheric stilling partly attributed to an increase in surface roughness, Nat. Geosci., 3, 756–761, https://doi.org/10.1038/ngeo979, 2010. a
Wikle, C. K. and Berliner, L. M.: A Bayesian tutorial for data assimilation, Physica D, 230, 1–16, https://doi.org/10.1016/j.physd.2006.09.017, 2007. a