 | 18 Jun 2026
Which forecast errors matter most? Assessing public priorities in weather forecast accuracy
Christoph Sauter
Kathrin Wapler
Weather forecasts are widely used for day-to-day decision making, and the recipients of the forecasts rely on accurate information to be able to make the best possible decisions. However, despite advances in forecasting, errors can still occur such an incorrect prediction of timing, location, intensity or persistence of a weather event. Based on the results from two surveys, this work aims to investigate how important the accuracy of each of these forecast attributes is to the general public by asking them to rate forecasts where one of the attributes is not correct. We show that even though all attributes are considered important for a satisfactory and useful forecast, forecasts that underestimate the intensity of an event or assume intermittent rainfall while the event turns out to be continuous receive the lowest ratings. Notably, we also found that survey participants rate forecasts worse if they perceive them as missed events rather than false alarms. Understanding the public's priorities regarding forecast attributes may contribute to forecasters' decisions about which attributes to prioritize or help the development of additional verification methods that take these preferences into account when evaluating the usefulness of forecasts for their users.
- Article
(1215 KB) - Full-text XML
-
Supplement
(1126 KB) - BibTeX
- EndNote


Weather forecasts play an important role in decision-making for the general public, influencing the planning of leisurely or work-related activities (Lazo et al., 2009; Rutty and Andrey, 2014; Silver, 2015). However, weather forecasts are inherently uncertain and this uncertainty can have implications for how weather-dependent decisions are made. Research has shown that the general public is aware of the uncertainty associated with weather forecasts (Joslyn and Savelli, 2010). In fact, when provided with a deterministic forecast value, people tend to infer some level of uncertainty themselves (Morss et al., 2008, 2010; Sivle et al., 2014). For example, a next-day deterministic temperature forecast of a single value might have an error margin of a few degrees.
Despite this, communicating the underlying forecast uncertainty remains challenging. Though uncertainty information is also often requested by the public, it is sometimes not interpreted correctly. Rainfall probability, e.g., is sometimes misinterpreted as the percentage of the forecast area or the percentage of a forecast time window that will experience rain (e.g., Gigerenzer et al., 2005).
However, an ideal forecast must also be able to predict several attributes of an event correctly. A forecast for a storm e.g., needs to predict the right time, location, intensity and persistence of its rainfall. Therefore, it is possible that one of these attributes is not forecast satisfactorily and the forecast as a whole is considered false, irrespective of if the other attributes are correct. This raises the question of whether certain attributes are more important to users than others, and whether not forecasting certain attributes correctly results in a worse perception of the forecast. According to Murphy (1993), forecast “goodness”, can be measured not only by how well it compares to observations, but by how well it helps decision-making. A good forecast provides sufficient information on how or whether to act when faced with weather information.
Recent work has shown that members of the general public prioritize different attributes of a warning such as location, timing, chance, severity, impacts and protective actions (Krocak et al., 2023). Also, the prioritization of these attributes changes with different timescales before the forecast event. When the event is more than one day away, members of the general public prioritize the location of the event as well as its likelihood while on timescales closer to the event, participants start prioritizing severity and impacts as well as information about protective actions.
In this work we analyse how the general public evaluates incorrect forecasts depending on which attribute (timing, intensity, location, or persistence) is wrong, and if it is important how their plans were influenced as a consequence. The findings of this study suggest that forecasters might benefit from focusing on the key aspects of a forecast that are most important to the general public, or contribute to the development of new and additional verification methods that evaluate the forecast based on the usefulness to the users.
2.1 Survey design and methodology
We conducted two separate in-person surveys during two “open house” events at the German Meteorological Service (Deutscher Wetterdienst, DWD). The first survey took place at the DWD headquarters in Offenbach on 14 September 2024, and the second survey was held at the regional laboratory in Hamburg on 14 June 2025. We refer to these as the “2024 survey” and “2025 survey”, respectively. The open house events were advertised through several local communication channels, including regional television and radio broadcasts, a local newspaper, the institution's website, and banners displayed at the buildings. Participants who completed the survey during the event are treated as a sample drawn from the general public. This group likely comprised local residents interested in learning more about the well-known institution in their community, as well as individuals with at least a general interest in topics such as weather, climate, or the environment. In some cases, attendees may also have had a more specific interest in weather-related matters, for example due to weather-dependent hobbies or involvement in voluntary emergency response services. Compared to the general public, those participants are likely overrepresented in our surveys and their evaluation of certain forecasts may differ. However, it is difficult to estimate how this might affect the results as it is both possible that participants familiar with weather and forecasting could either rate an incorrect forecast more or less favourably depending on their expectations and prior knowledge. The surveys were presented on posters, allowing visitors to inspect and participate. Ballot boxes were positioned in front of the posters for participants to record their votes. Both surveys contained six cases showing sample forecasts for a specific weather event and the actual observed weather. One of the posters, containing two cases, is shown in Fig. 1. The complete list of cases can be found in the Supplement (Table S1). In total eight different cases were shown with four of these cases used at both events allowing us to compare results from the two events and test for comparability between the two surveys. All cases involved rainfall or thunderstorm events.
Each case was divided into three parts and included a fictitious weather-related story. Participants were asked to imagine having planed a leisure activity and taking the weather forecast into account. The first part described the forecast and its influence on their planning. The forecast was presented in form of a map of Germany with coloured shading of the affected area and a short accompanying text. The next section showed how the weather turned out differently, illustrated by a picture or a map with measurements and described in a short text. The incorrectly forecast attribute was then highlighted in one concluding sentence. Finally, the participants graded the forecast based on its quality, using the German school grading system with grades ranging from 1 (“excellent forecast”) to 6 (“insufficient forecast”). We acknowledge that these fictional scenarios may not fully capture real-world decision-making contexts where additional or more complex factors play important roles as well. However, this setup allowed us to isolate the role of specific forecast attributes and outcomes on the perception of each forecast.
The cases were shown on vertical columns with two cases per poster, making a total of three posters. An introductory poster on forecast quality was also displayed next to the survey posters. The participants could choose which poster to start with, but most likely started with the introductory poster and then continued with the cases. The posters were ordered as follows; in the 2024 survey, the cases were ordered (starting with the case closest to the introductory poster) B, C, F, A, E, D, and in the survey 2025 they were ordered B, G, E, H, F, A (for a description of the cases see Sect. 2.2). It is likely that most participants read and rated each case one by one without reading all cases beforehand. However, participants might have compared the current case with those they had previously seen. This could have introduced biases in the assessment of certain cases, which might have been evaluated differently if presented independently or in a randomized order. As the two surveys took part in different cities, it is unlikely that the same person participated at both surveys. The survey design ensured that all responses remained anonymous, however also meant that no demographic information of the participants was gathered either.
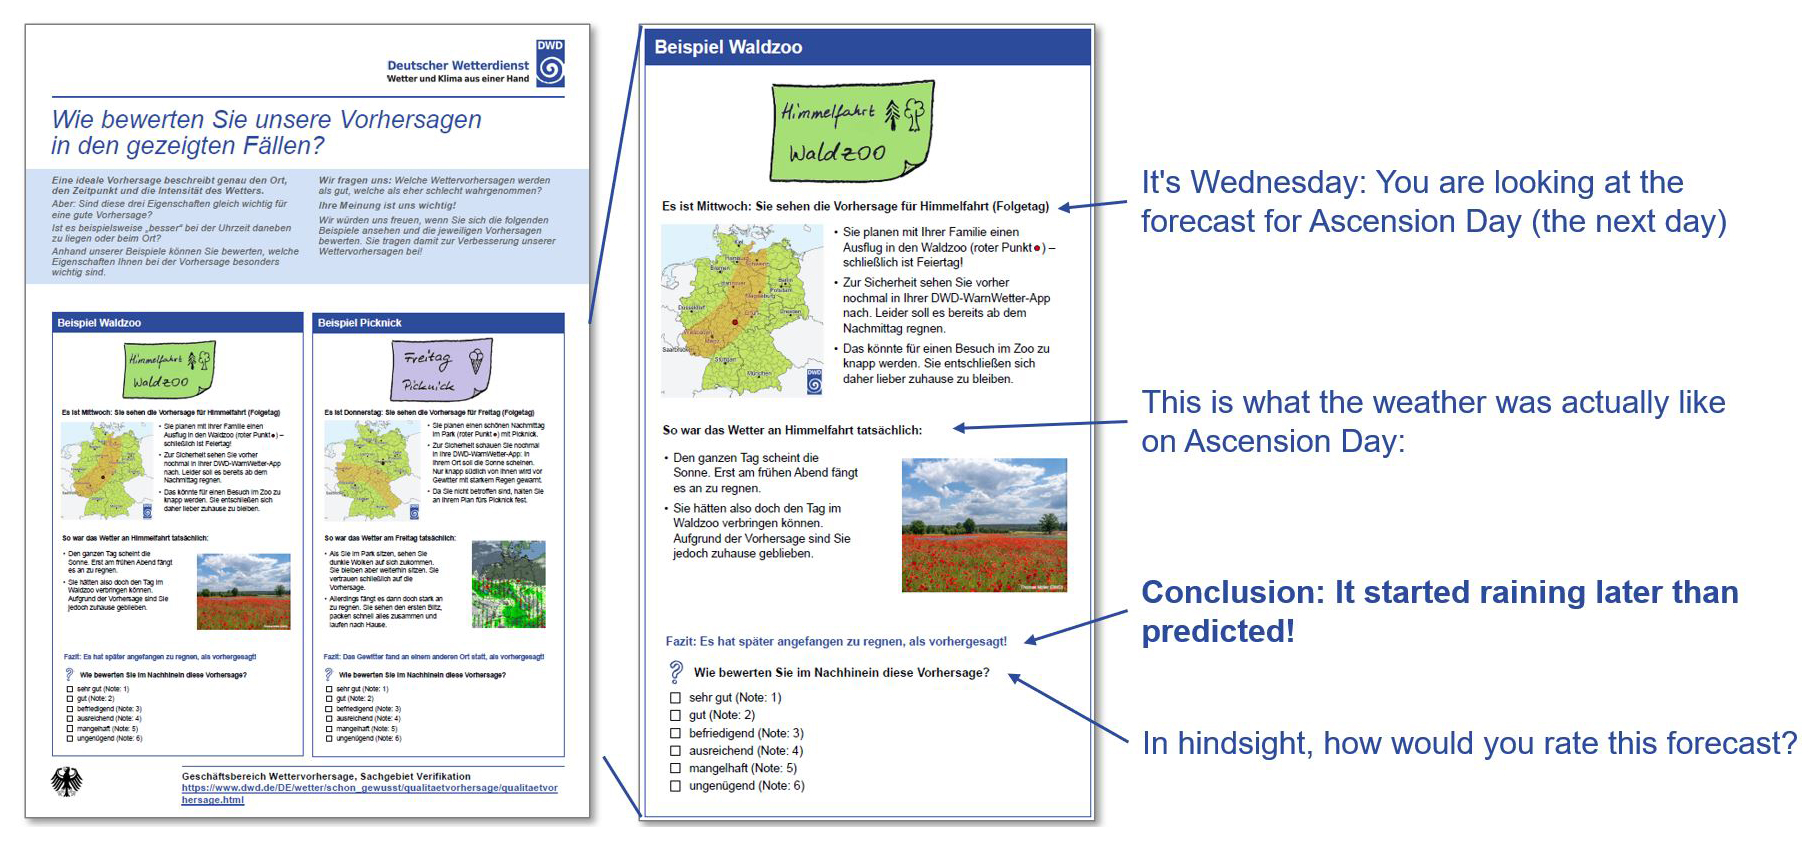
Figure 1One of the posters used during the 2024 survey containing cases C (left) and B (right). Case C is enlarged and the key information translated into English.
2.2 Description of the different cases
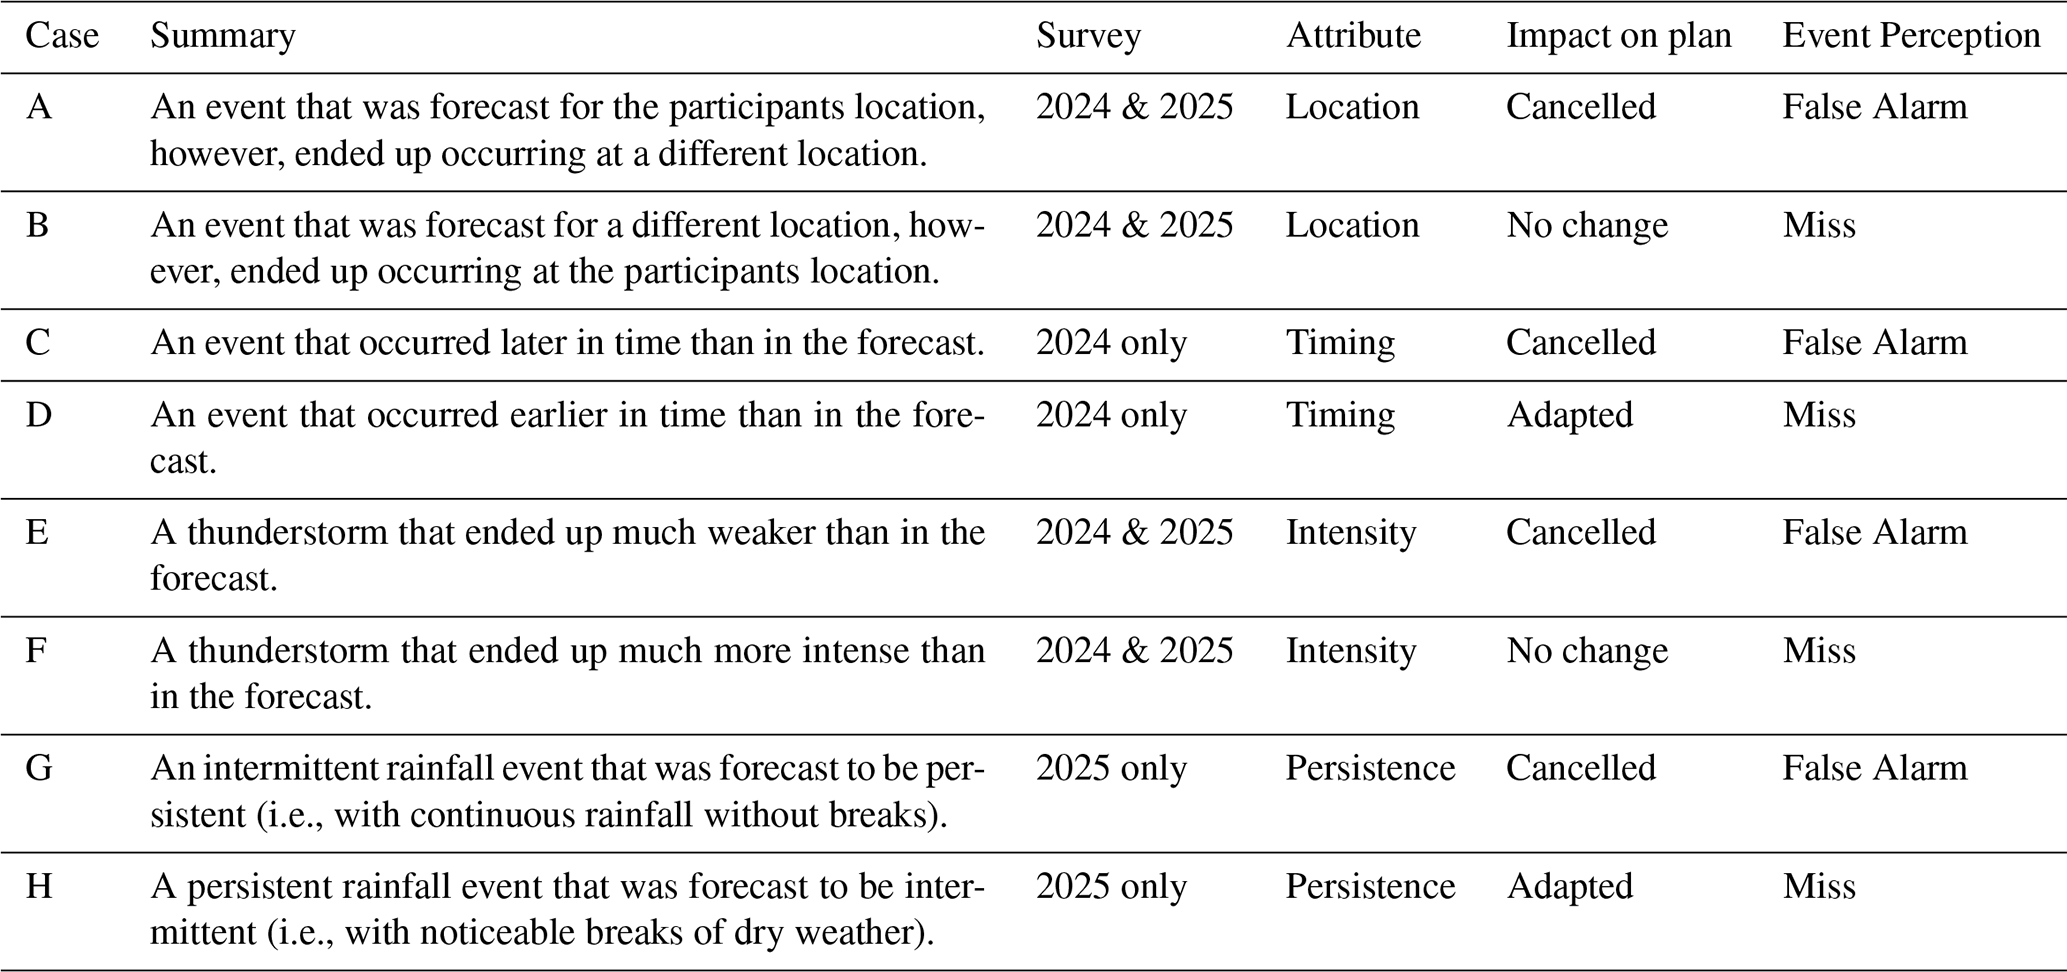
Each of the cases addressed one of the forecast attributes: intensity, duration, location and persistence. The cases are summarized in Table 1. The cases can be grouped into four categories based on the attribute in error: wrong location (A and B), wrong timing (C and D), wrong intensity (E and F), and wrong event persistence (G and H). The 2024 survey included cases with incorrect location, timing, and intensity (A, B, C, D, E, F), while the 2025 survey included cases with incorrect location, intensity, and persistence (A, B, E, F, G, H). These cases can also be grouped into two categories based on the accuracy of the weather character (i.e., intensity and persistence). Cases A, B, C, and D had correct weather character but errors in location or timing, while cases E, F, G, and H had correct location and timing but errors in weather character.
Additionally, the cases can be divided into two groups based on the outcome. In cases A, C, E and G the forecast led to cancelled plans and the weather turned out not to happen as predicted. In these cases, the forecast might have been perceived as a False Alarm. In contrast, in cases B, D, F and H the forecast did not lead to cancelled plans, and the weather event unexpectedly turned out to happen at their location, during their activity, or was more severe or more persistent. Here, the forecast might have been perceived as a missed event. However, it should be noted that the cases were not explicitly labelled as false alarms or missed events and therefore, participants might not have interpreted them as such.
2.3 Data
A total of 1424 votes were cast across both surveys with 965 votes in the 2024 survey and 615 in the 2025 survey. Participants could vote in each of the six cases, although it was not required to vote on all cases. As a result, it is not possible to determine the exact number of participants, only the total number of votes for each case. This makes it difficult to assess the robustness of the results and future study designs would benefit from gathering participant numbers and basic demographic data as well as which cases they voted on. Nonetheless, our study offers a useful first view into the public preferences of forecast accuracy when taking these limitations into account. In both surveys, the case closest to the introductory poster received the most votes. Specifically, in the 2024 survey (listed in the order they appeared on the poster, starting with the case closest to the introductory poster), the cases received the following number of votes: case B received 217 votes, followed by case C with 160 votes, case F with 140 votes, case A with 140 votes, case E with 152 votes, and case D with 156 votes. Similarly, in the 2025 survey, case B received 93 votes, followed by case G with 69 votes, case E with 86 votes, case H with 82 votes, case F with 69 votes, and case A with 60 votes.
The results of the surveys were analysed based on the forecast attributes (Sect. 3.1), and how the forecast was perceived based on whether plans were cancelled or adapted as a result (Sect. 3.2). The results of the two surveys are compared in Sect. 3.3.
3.1 Results analysed by attribute
When combining the results of both surveys, we find that the perception of a forecast differs depending on which attribute is incorrect. Figure 2 shows the distribution of ratings divided by the attributes location, timing, intensity, and persistence. Regarding the location attribute, forecasts are perceived worse if the weather event is forecast for a different location but occurs at the participant's location (average 3.69; case B). In contrast, if the event is forecast for the participant's location but occurs elsewhere (case A), participants have a more favourable view of the forecast (average 3.17). This case received the best marks and lowest standard deviation of all cases. While both rating distributions follow a normal shape, the ratings are more evenly distributed for case B, with mark 4 being the most often chosen rating. For case A, marks 2 and 3 were by far the most chosen ratings.
For the timing attribute, forecasts where events were predicted too early or too late received similar average ratings, although in comparison, the forecast where the event occurred earlier than predicted was rated slightly worse. Overall, these forecasts are rated more favourably (grade averages 3.19 for case C and 3.28 for case D) when compared with the other attributes. Both rating distributions are right-skewed with the most chosen rating being 2. However, in case D mark 5 was the second most chosen rating (tied with mark 3) resulting in a less normally shaped distribution.
The perception of forecasts with incorrect intensity differs depending on if the intensity was forecast too low (“under forecast”, case F) or too high (“over forecast”, case E). A forecast with too low intensity compared to the actual outcome received the second worst results out of all eight cases (4.08). While the forecast with too high intensity compared to the actual outcome was perceived better on average (3.63) the standard deviation was the highest for this case, indicating that the participants were more divided on how they perceived such a warning. This is also visible in the rating distribution which is comparably uniform, especially compared to the distribution of case F, which is left-skewed with a maximum at mark 5.
Besides intensity, location, and timing, the persistence of an event, if predicted incorrectly, plays a crucial role in how the forecasts are perceived. A rainfall event that turns out be persistent despite the forecast predicting it to be intermittent (case H) received the worst rating out of all eight cases (average 4.35) and mark 6 (“insufficient”) was the most chosen rating. In contrast, a rainfall event that was predicted to be continuous but turned out to be intermittent (case G) was seen more favourably (average 3.46) with the rating distribution following a more normal shape and a clear maximum at mark 3. However, cases G and H were only shown during the 2025 survey and therefore received fewer votes in total.
From an event perspective, the forecasts can be divided into whether the event was correctly forecast in character (i.e., its intensity and persistence) and wrong in its location and timing, or wrong in character but right in location and timing. We find that forecasts where the character of the event is predicted incorrectly (cases E, F, G, H) are mostly rated worse than those where the location or timing are incorrect (cases A, B, C, D) with the sole exception that case B received slightly worse marks than E and G.
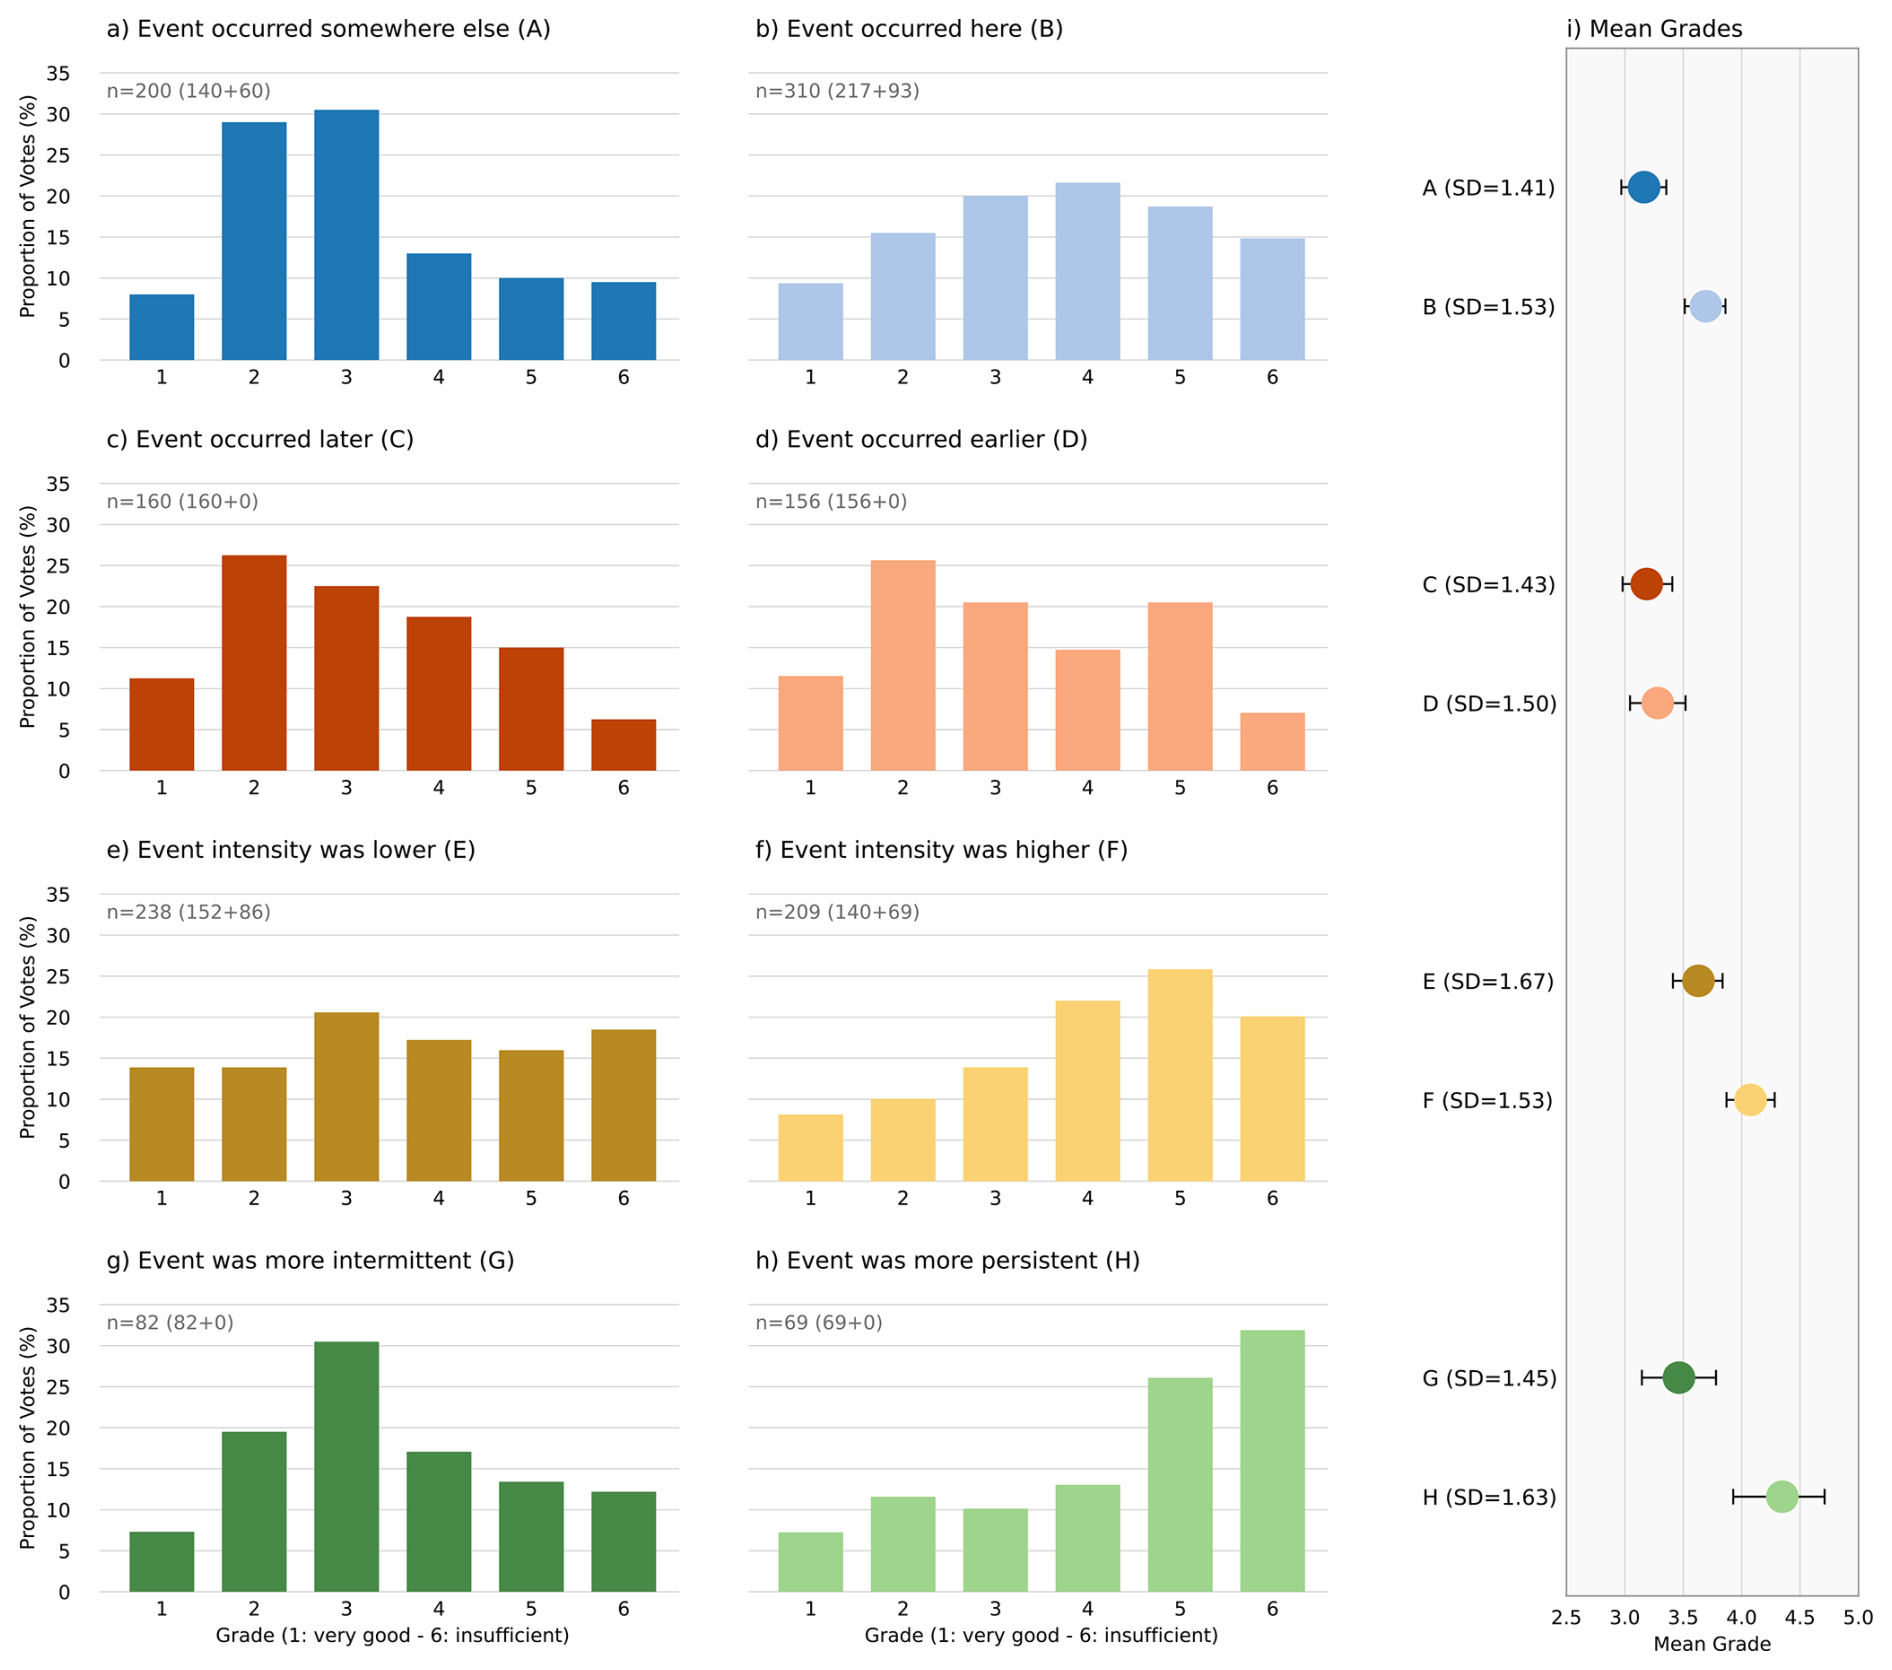
Figure 2Combined results from both surveys for each case (a–h). Grades range from 1 (“very good forecast”) to 6 (“insufficient forecast”). n denotes the number of votes received for each case with separation into the 2024 and 2025 surveys in brackets. Coloured dots show the mean grades for each case (i). Error bars show the sampled 95th percentile confidence intervals for the mean grade obtained from bootstrapping with 1000 repetitions. SD denotes the standard deviation of grades for each case.
3.2 Results analysed by outcome
In addition to focussing on the attribute of the forecast, the impact of the forecast on the individual plans played an important role in how the forecast was rated. We found that when plans were cancelled due to the forecast, but the weather event did not occur or was weaker as predicted, the forecasts received an average mark of 3.36 (cases A, C, E, G, see left column in Fig. 2). The rating for these cases, except for case E, are normally distributed or right-skewed with maxima at mark 2 or 3. From the recipient's perspective, this kind of forecast can be viewed as a False Alarm where the weather's impact on their original plans was less severe than anticipated.
On the other hand, if plans were only adapted or remained unchanged in response to the forecast, but the actual weather was worse than expected, the cases received a lower average mark of 3.85 (cases B, D, F, H, see right column in Fig. 2). This second kind of forecast can be seen as a missed event, where the weather had a greater negative impact than expected. The rating for these cases, except for case D, are either normally distributed or left-skewed with maxima at mark 4 or 5. We hypothesize that the uneven distribution in case D results from the case-specific outcome used (“Although you make it back to your car on time, it starts to rain and hail heavily just before you arrive.”; see Table S1), for which it may be less clear whether participants perceive the forecast as a missed event, potentially leading to greater disagreement in ratings.
3.3 Comparison of the surveys
To assess the consistency of our findings, we compared the scores for cases A, B, E, and F which were used in both surveys. The average score differences between the two surveys were 0.34 for case A, 0.24 for case B, 0.03 for case E, and 0.01 for case F. Notably, the score differences were more pronounced for cases involving location attributes (A and B) compared to intensity attributes (E and F). In cases A and B, the average score was lower in the 2025 survey. Overall, the respondents in both surveys voted similarly, indicating some level of robustness despite the non-representative sample. This suggests that the results may be generalizable to a wider population, although further research is needed to confirm this.
The results from the surveys indicate that the general public places different levels of importance on different attributes of weather forecasts. The underestimation of intensity and persistence of a weather event is rated particularly negatively. While incorrect forecasts of the other attributes such as timing and location are seen more favourably in comparison, none of these scenarios received better than average marks, indicating that all attributes are considered important. These findings support the research by Krocak et al. (2023) which showed that event severity and protective actions are considered the most important forecast attributes with two or fewer days before the forecast event.
Moreover, our study shows that forecasts are evaluated differently depending on whether errors are perceived as False Alarms or missed events. For instance, participants assigned different ratings to cases A and B, even though both involved incorrect forecast locations. When an event unexpectedly occurred at the participant's location (a missed event), it was rated more negatively than when an event was forecasted but did not materialize there (a False Alarm). This difference suggests that users are more sensitive to missed events than to False Alarms, and there is also evidence that the general public perceives the frequency of False Alarms to be lower than it actually is (Trainor et al., 2015).
Overall, these results highlight the importance of incorporating the recipient's perspective when assessing forecast quality. Forecasts associated with missed events were consistently rated worse than their false alarm counterparts, highlighting the need to better account for user-relevant outcomes in forecast evaluation. However, the practical implementation such as accounting for user-specific location and experience remains a significant challenge.
Our study's findings are based on two surveys conducted as part of the DWD's open house events. While these events provided a unique opportunity to gather data, we recognize that the results may not be representative of the entire general public. Therefore, separate surveys with representative samples would be necessary to confirm our findings which would also allow for more robust statistical testing. Similarly, such studies could also vary the order the cases are presented to participants to explore to what extent the comparison between the cases affects how they are perceived.
Our work highlights the need for understanding the needs and requirements of weather forecast recipients. As emphasized by Kox et al. (2018), it is crucial to establish a strong dialogue between the provider and the recipient of forecasts to best understand their needs and provide a useful forecast.
One possible approach to address the differences in valued attributes is to provide uncertainty information about the individual attributes themselves. Wapler and Sivle (2025) found that the recipients of forecasts were generally interested in information of uncertainty in the location, timing and intensity of the forecasts. However, further research is needed to explore whether this information can be provided with adequate quality and how it could be presented in a useful manner.
Due to DWD regulations, the code is not publicly available. The study uses only the data collected in the survey which was developed and conducted for the purpose of this study; it is therefore not publicly available.
The supplement related to this article is available online at https://doi.org/10.5194/asr-23-1-2026-supplement.
CS: Conceptualization, Data curation, Visualization, Writing (original draft preparation). KW: Conceptualization, Data curation, Visualization, Writing (review and editing).
The contact author has declared that neither of the authors has any competing interests.
Publisher's note: Copernicus Publications remains neutral with regard to jurisdictional claims made in the text, published maps, institutional affiliations, or any other geographical representation in this paper. The authors bear the ultimate responsibility for providing appropriate place names. Views expressed in the text are those of the authors and do not necessarily reflect the views of the publisher.
This article is part of the special issue “EMS Annual Meeting: European Conference for Applied Meteorology and Climatology 2025”. It is a result of the EMS Annual Meeting 2025, Ljubljana, Slovenia, 7–12 September 2025. The corresponding presentation was part of session ES2.2: Communicating science and dealing with Uncertainties.
The authors would like to thank Dinah Rode and Mara Gehlen-Zeller for their helpful suggestions on the design of the surveys, as well as all survey participants. The authors are grateful to the reviewers for their useful comments that helped improve the manuscript. Additionally, the authors acknowledge the use of a large language model to assist in editing the manuscript and improving its clarity.
This work was supported by the Deutscher Wetterdienst research programme “Innovation Programme for Applied Research and Development (IAFE)”.
This paper was edited by Gerald Fleming and reviewed by two anonymous referees.
Gigerenzer, G., Hertwig, R., Van Den Broek, E., Fasolo, B., and Katsikopoulos, K. V.: “A 30 % chance of rain tomorrow”: How does the public understand probabilistic weather forecasts?, Risk Analysis: An International Journal, 25, 623–629, 2005.
Joslyn, S. and Savelli, S.: Communicating forecast uncertainty: Public perception of weather forecast uncertainty, Meteorol. Appl., 17, 180–195, 2010.
Kox, T., Kempf, H., Lüder, C., Hagedorn, R., and Gerhold, L.: Towards user-orientated weather warnings, Int. J. Disast. Risk Re., 30, 74–80, 2018.
Krocak, M. J., Ripberger, J. T., Ernst, S., Silva, C., Jenkins-Smith, H., and Bitterman, A.: Public information priorities across weather hazards and time scales, B. Am. Meteorol. Soc., 104, E768–E780, 2023.
Lazo, J. K., Morss, R. E., and Demuth, J. L.: 300 billion served: Sources, perceptions, uses, and values of weather forecasts, B. Am. Meteorol. Soc., 90, 785–798, 2009.
Morss, R. E., Demuth, J. L., and Lazo, J. K.: Communicating uncertainty in weather forecasts: A survey of the US public, Weather Forecast., 23, 974–991, 2008.
Morss, R. E., Lazo, J. K., and Demuth, J. L.: Examining the use of weather forecasts in decision scenarios: Results from a US survey with implications for uncertainty communication, Meteorol. Appl., 17, 149–162, 2010.
Murphy, A. H.: What is a good forecast? An essay on the nature of goodness in weather forecasting, Weather Forecast., 8, 281–293, 1993.
Rutty, M. and Andrey, J.: Weather forecast use for winter recreation, Weather Clim. Soc., 6, 293–306, 2014.
Sivle, A. D., Kolstø, S. D., Kirkeby Hansen, P. J., and Kristiansen, J.: How do laypeople evaluate the degree of certainty in a weather report? A case study of the use of the web service yr.no., Weather Clim. Soc., 6, 399–412, https://doi.org/10.1175/WCAS-D-12-00054.1, 2014.
Silver, A.: Watch or warning? Perceptions, preferences, and usage of forecast information by members of the Canadian public, Meteorol. Appl., 22, 248–255, 2015.
Trainor, J. E., Nagele, D., Philips, B., and Scott, B.: Tornadoes, social science, and the false alarm effect, Weather Clim. Soc., 7, 333–352, 2015.
Wapler, K. and Sivle, A.: How to best evaluate and communicate the value of severe weather warnings?, Adv. Sci. Res., 22, 87–95, https://doi.org/10.5194/asr-22-87-2025, 2025.