 | 20 Feb 2020
Computation of daily Penman–Monteith reference evapotranspiration in the Carpathian Region and comparison with Thornthwaite estimates
Mónika Lakatos
Tamás Weidinger
Lilla Hoffmann
Zita Bihari
Ákos Horváth
The Pannonian Basin Experiment (PannEx) is a Regional Hydroclimate Project (RHP) of the World Climate Research Programme (WCRP) Global Energy and Water Exchanges (GEWEX) Project. A gridded meteorological dataset is available for the PannEx region as part of the CarpatClim database, which consists of homogenized and harmonized daily meteorological observations for several climate parameters with 0.1∘ spatial resolution in the period of 1961–2010. The estimation of the Penman–Monteith reference evapotranspiration (ET0) on the daily scale was performed for the CarpatClim grid as one of the first results in the PannEx initiative. This study compares the already accessible Thornthwaite estimates of potential evapotranspiration (PET_Th) on the monthly scale to the newly derived Penman–Monteith estimates. The comparison is made on an annual and seasonal basis for the 50-year period. The distribution of both estimates is influenced by geographical location and orographic features. The annual time series are similar but the regional-average annual values of ET0 are ∼80 mm greater than the Thornthwaite estimate in the whole CarpatClim region. The relative bias and root mean square error was computed as well. The classical Thornthwaite method underestimates the ET0 by more than 20 % over extensive regions for selected grid points at elevations lower than 200 m in the Pannonian Basin. The slope of the fitted linear trend indicate increasing reference evapotranspiration in the Pannonian/Carpathian Basin due to climate change.
- Article
(4496 KB) - Full-text XML
- BibTeX
- EndNote


The Global Energy and Water Exchanges (GEWEX) Hydroclimatology Panel (GHP) provides a framework to assist with the understanding and prediction of hydroclimatic conditions from continental to local scale by improving our knowledge of environmental water and energy exchanges at the regional scale. (GEWEX, 2020 – https://www.gewex.org/, last access: 5 February 2020).
The PannEx is a Regional Hydroclimate Project (RHP) of the GEWEX GHP. It is a GEWEX- initiated, community driven research network in the Pannonian/Carpathian Basin (both names are used). It aims to achieve a better understanding of the Earth System components and their interactions in the Pannonian Basin (PannEx, 2020 – https://sites.google.com/site/projectpannex/, last access: 5 February 2020). The international efforts in PannEx involve research institutions, universities and national meteorological and hydrological services in an integrated approach towards identifying and increasing adaptation capacity to face climate change in the Pannonian Basin.
The PannEx research community has prepared a White book with the objective of first to identify the main scientific issues to address, and then drawing up a detailed science plan to define the major objectives outlined (Ceglar et al., 2018; PannEx White Book, 2019).
The Pannonian Basin (Fig. 1) is enclosed by the Carpathians and the Transylvanian Plateau to the east and north. Over these regions, the Romanian Lowlands and the Subcarpathian depressions beyond the Carpathians (also known as Transcarpathia) are in the focus of PannEx initiative (Matenco and Radivojević, 2012; Haas et al., 2013).
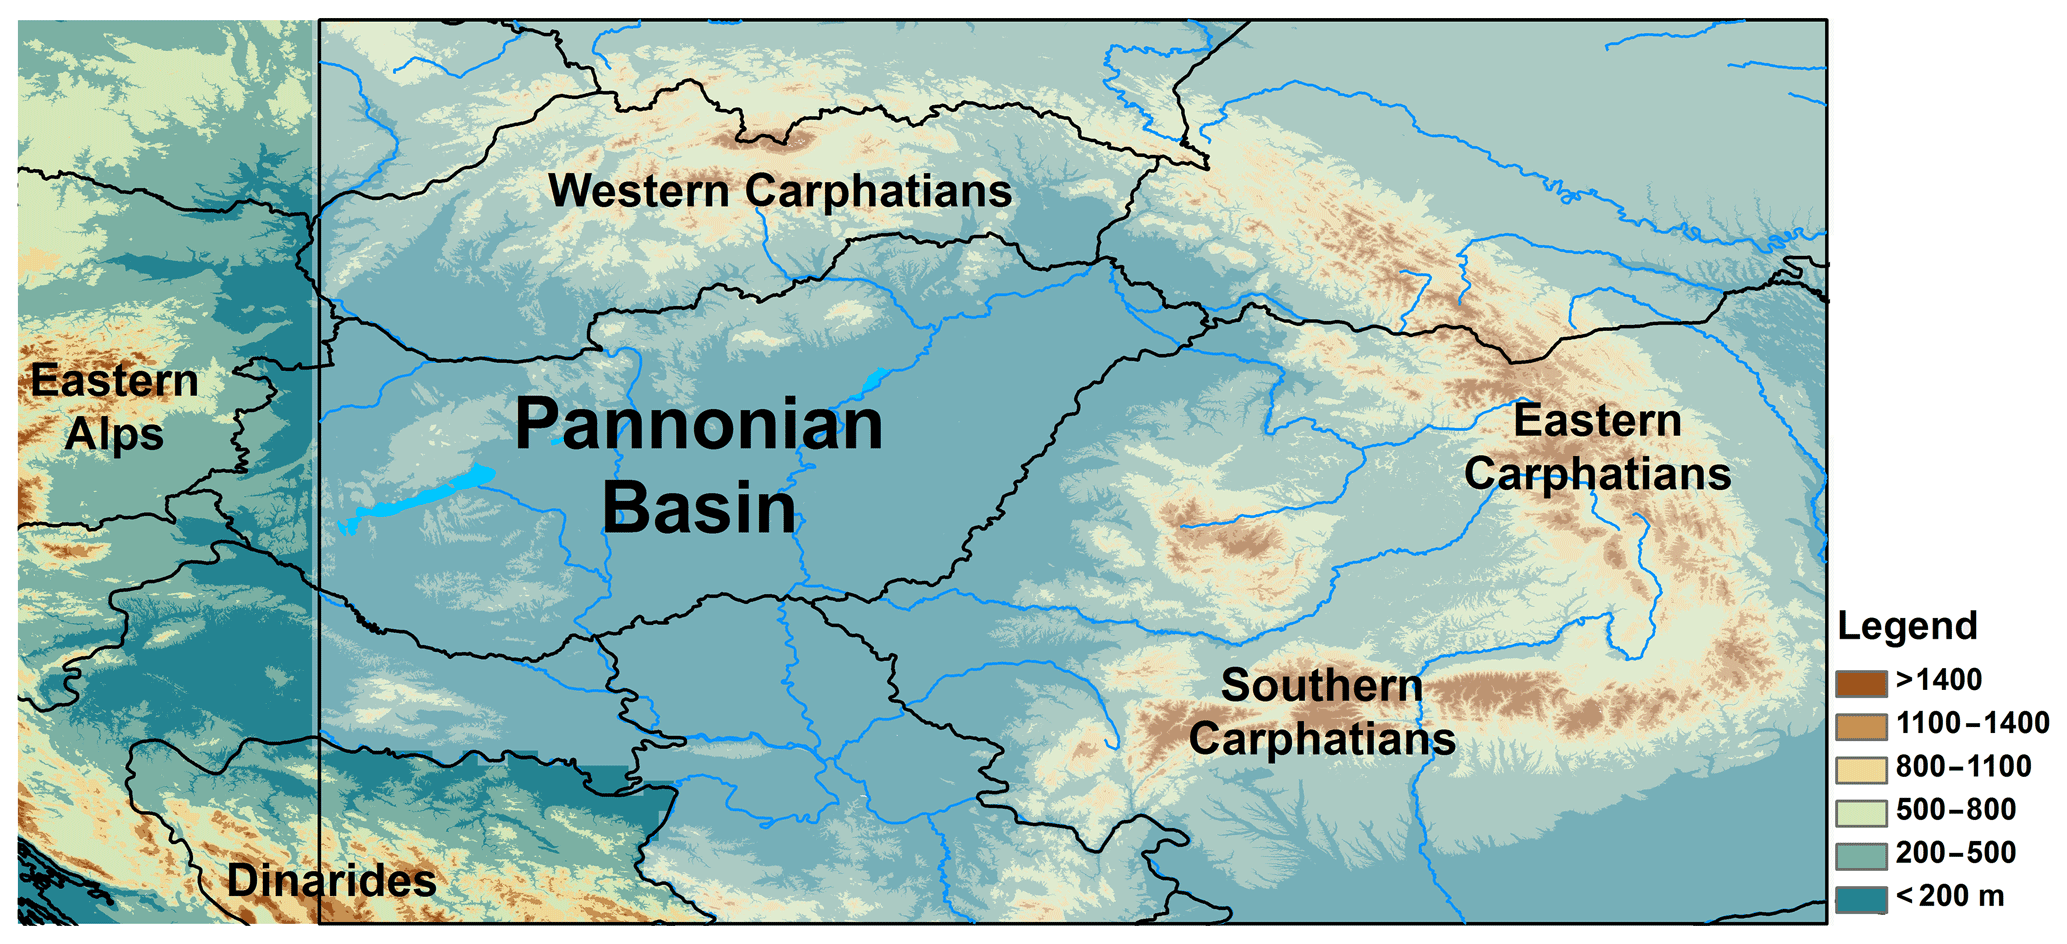
Figure 1The Pannonian Basin with major orographic and river systems. The area of CarpatClim dataset is shaded.
The almost-closed structure of the Pannonian Basin in the heart of the European continent makes it a good natural laboratory for studying the water and energy cycles, focusing on the relevant physical processes. However, the data required for estimation of the radiation balance (short- and longwave) and surface energy budget components (net radiation, soil heat flux, sensible and latent heat fluxes) in a daily or finer temporal scale are missing for regional studies. Moreover no long-term coherent soil moisture dataset is available over the Pannonian Basin for studying water and energy cycles. However, the effective precipitation (precipitation – potential evapotranspiration) is an important limiting factor in the agriculture of the Pannonian Basin, and soil moisture content exhibits a strong relationship with dry and wet spells (see also Seneviratne et al., 2006; Torma et al., 2011; Pieczka et al., 2017).
There are various approaches to the definition of the different types of evapotranspiration to describe the evaporative demand of the atmosphere. In the physical sense, actual evapotranspiration (AET) is the sum of the evaporation (E) from the water, soil and plant cover and the amount of water transpired by plants (T). This is often limited by the currently available energy and evaporable water, as well as by characteristics of the plant cover and the soil. Based on these factors, we can distinguish (i) the climatic potential evaporation (C_PET), (ii) the potential evapotranspiration (PET) and (iii) different types of calculation of PET for example the Penman–Montieth reference evapotranspiration (ET0) or Thornthwaite type potential evapotranspiration (PET_Th) in order to clarify the definitions for general application (McMahon et al., 2013; Lang et al., 2017). Climatic potential evapotranspiration is the maximal possible level of evapotranspiration from a surface saturated in water under given land-use and climatic conditions (Katerji and Rana, 2011). This is the evapotranspiration potential of a given land use. Climatic potential evapotranspiration depends on the characteristics and type of the evaporative surface (bare soil, low and high vegetation, water body, forest, etc.). Thus, climatic potential evapotranspiration is a function of atmospheric forcing and surface types (Rey, 1999; Katerji and Rana, 2011).
The concept of potential evapotranspiration (PET), as described by Penman (1948), is “the amount of water transpired in a unit of time by a short green crop completely shading the ground, of uniform height, and never short of water” (Sellinger, 1996). According to Anon (1956) PET is defined by removing the influence of surface type from the calculation.
On the basis of the Penman–Monteith methodology, reference evapotranspiration (ET0) was introduced to study the evaporative demand of the atmosphere independent of crop type, crop development and agricultural practices (Allen et al., 1998). ET0 represents the theoretical evapotranspiration from an assumed reference surface: an extensive surface of green grass of uniform height, actively growing, completely shading the ground, and not short of water.
According to Allen et al. (1998) the use of other denominations, such as potential evapotranspiration, is strongly discouraged due to ambiguities in their definitions. Based on the review papers ET0 has become one of the most widely used methodologies for calculation of evapotranspiration and evaporative demand (Fisher et al., 2005, 2011; McMahon et al., 2013; Rácz et al., 2013; Lang et al., 2017).
In practice, estimation of actual evapotranspiration (AET) is often made by using information about potential evapotranspiration and (i) soil moisture (e.g. Dyck, 1983; Sellinger, 1996; Ács et al., 2011; Ács, 2017), (ii) plant constants (Allen et al., 1998; Nistor et al., 2016), (iii) standard meteorological data (McMahon et al., 2103) and combined satellite and ground-based measurement (Westerhoff, 2015; Barik et al., 2016). The estimation of evapotranspiration has been widely used not only in agricultural hydrology for planning crop irrigation water needs (Allen et al., 1998), but also in drought monitoring (Vicente-Serrano et al., 2010; Ziese et al., 2014), water balance modelling (Bai et al., 2015), land surface modelling (Niu et al., 2011) and regional biodiversity modelling by ecologists (Currie, 1991), forest hydrology (Rao et al., 2011), and in research of forest ecosystems (Fisher et al., 2005), for example.
Various methods are available to estimate the potential evapotranspiration from standard meteorological observations (Rácz et al., 2013; Lang et al., 2017). The classical Thornthwaite (1948) temperature-based method (PET_Th) is widely used for estimation of evaporative demand, it being calculated only on the basis of air temperature and latitude of the site (Ács et al., 2011). The Penman–Monteith method is considered to be the most physical and reliable method for estimation of potential evapotranspiration and is often used as a standard to verify other empirical methods (Lang et al., 2017).
Our first task in PannEx was the computation of the reference evapotranspiration (ET0) on a daily scale for the CarpatClim grid. The CarpatClim database also provides Thornthwaite estimate of potential evapotranspiration on a monthly basis, which is too coarse for several applications. The objectives of this study are: (i) to estimate (ET0) for the whole CarpatClim dataset in the period 1961–2010 on the daily scale by using the Penman–Monteith method (Allen et al., 1998; Zotarelli et al., 2010), and (ii) to compare ET0 with the classical Thornthwaite estimates (PET_Th).
The structure of the applied dataset and methodologies and the first results of the comparisons together with the linear trend values of ET0 in the period 1961–2010 are presented in the following sections.
The CarpatClim dataset includes gridded daily minimum, mean and maximum temperature, precipitation, wind direction and speed at a 10 m height, sunshine duration, cloud cover, global radiation, relative humidity, vapour pressure, air pressure and snow depth data along with several climate indicators, 37 in total on a ∼10 km (0.1∘) spatial resolution grid. Climatological grids cover the area between latitudes 44 and 50∘ N, and longitudes 17 and 27∘ E. The time period of the dataset is 1961–2010. The data can be downloaded from the project website: http://www.carpatclim-eu.org (last access: 5 February 2020; CarpatClim, 2020a) (see also in Szalai and Vogt, 2011; Lakatos et al., 2013).
The target area of CarpatClim partially includes the territories of the Czech Republic, Slovakia, Poland, Ukraine, Romania, Serbia, Croatia, Austria and Hungary. Data from 415 climate stations and 904 precipitation stations were used to create dataset (Lakatos et al., 2013; Spinoni et al., 2015; Cuxart and Matjačić, 2015).
To ensure the use of the largest possible station density, the processing of the homogenization and gridding was implemented by the countries themselves using identical methods and software. The commonly used methods were the MASH (Multiple Analysis of Series for Homogenization; Szentimrey, 1999, 2011) procedure for homogenization, quality control, and completion of the observed daily data series; and the MISH (Meteorological Interpolation based on Surface Homogenized Data Basis; Szentimrey and Bihari, 2007) for the gridding of homogenized daily data series. The uncertainty metrics of the gridded parameters are available as the project deliverable 2.5 (CarpatClim D2.5, 2020b). The harmonization of the data was carried out by exchange of near-border station data between neighbouring countries before and after homogenization. The aim of the harmonization was the matching of national grids so as to remove edge effects. It is noted that snow depth was estimated by ZAMG snow model (Szentimrey, 2012; Olefs et al., 2013). The CarpatClim is widely used for validation purposes for regional climate model simulations and for climate vulnerability assessments (Chervenkov et al., 2019; Torma 2019). Public access to CarpatClim dataset is through the website of the Copernicus Climate Change Service as an external sub-regional dataset (Copernicus CCS, 2020; http://surfobs.climate.copernicus.eu/dataaccess/access_carpatclim.php, last access: 5 February 2020).
The CarpatClim database also provides Thornthwaite estimate of potential evapotranspiration (PET_Th) on a monthly basis, derived from the geographic position, the average day length (hours) of the month, the monthly average temperature and the monthly and yearly heat indices derived from these variables (Sellinger, 1996; Mihic et al., 2013). The monthly dataset allows the examination of the evaporation conditions of the Pannonian Basin where the monthly time scale is appropriate (Nistor et al., 2016). The CarpatClim drought indices and monthly PET_Th have been used for European drought monitoring and drought assessment (Spinoni et al., 2013) and for evaluation of the EUMETSAT LSA-SAF evapotranspiration products .(Sepulcre-Canto et al, 2014), for example.
This study is a substantial step moving from the temperature-based, monthly Thornthwaite (PET_Th) expression to the fully physical, daily Penman–Monteith ET0. Our main applied scientific goal was to develop a procedure for computing of ET0 on a daily basis for CarpatClim, as the daily values are essential for examining processes at temporal scales for which the monthly Thornthwaite data are insufficient.
The widely used Penman–Monteith Reference Evapotranspiration method, the so-called FAO-56 methodology (Allen et al., 1998) is applicable for the computation of daily ET0 for the CarpatClim database. The Penman–Monteith method combines both energy and mass balances to model the ET0. It is based on fundamental physical principles, which guarantee the universal validity of the method. However, it needs a number of meteorological variables which may not be available everywhere. One of the advantages of CarpatClim dataset that all climate variables, required for calculation of ET0 are available. The method assumes a surface of short grass (0.12 m high) that is well watered, actively growing, completely shades the soil, and has an albedo of 0.23. The necessary variables we used for estimation of the radiation balance and ET0 are as follows: global radiation (direct and diffuse short wave radiation), temperature (mean, maximum, and minimum), wind speed and relative humidity at 2 m above the ground. The 17-step calculation process published by experts from the University of Florida (Zotarelli et al., 2010) was adapted and coded for the CarpatClim dataset.
The formula used to express reference evapotranspiration ET0 (mm d−1) and which we applied for the gridded daily data is the following Eq. (1):
where Rn is the net radiation at the crop surface (MJ m−2 d−1), G is the soil heat flux density (MJ m−2 d−1) (at daily timescales G is assumed to be zero), T is the mean daily air temperature at 2 m height (∘C), u2 is the wind speed at 2 m height (m s−1), es is the saturation vapor pressure (kPa), ea is the actual vapor pressure (kPa), es−ea is the saturation vapor pressure deficit (kPa), Δ is the slope of the vapor pressure curve (kPa ∘C−1), γ is the psychrometric constant (kPa ∘C−1).
The comparison between Penman–Monteith ET0 and Thornthwaite PET_Th estimates is made on annual and seasonal (spring: MAM, summer: JJA, autumn: SON and winter: DJF) basis. The Fig. 2 shows the annual and seasonal averages (mm) of Penman–Monteith estimates of ET0 and Thornthwaite estimates for PET_Th over the CarpatClim region for the 50 years from 1961–2010. The spatial distribution of both estimates is influenced by geographical location and the orographic features of the Larger Carpathian region: the Carpathian Chain together with the Carpathian Basin. The highest differences in the annual averages appear at lower elevations in the middle and south-eastern part of the region. The spatial average annual Penman–Monteith estimates are ∼80 mm greater than the Thorntwaite estimation for the whole CarpatClim region. A similar spatial pattern of the differences can be found in spring, with the Penman–Monteith estimates by 60 mm on a regional average. The summer estimates are in good agreement, although Thorntwaite estimates are lower in the Pannonian Basin, which is the focus area of the PannEx initiative. Areas of differences between the Penman–Monteith ET0 values and the Thornthwaite estimates appear on the map illustrating autumn. The winter Thornthwaite estimates (PET_Th) are below 20 mm at all the grid points in the CarpatClim region: much lower than the Penman–Monteith estimates which show even 60 mm ET0 in the lowlands in the southern part of the region.
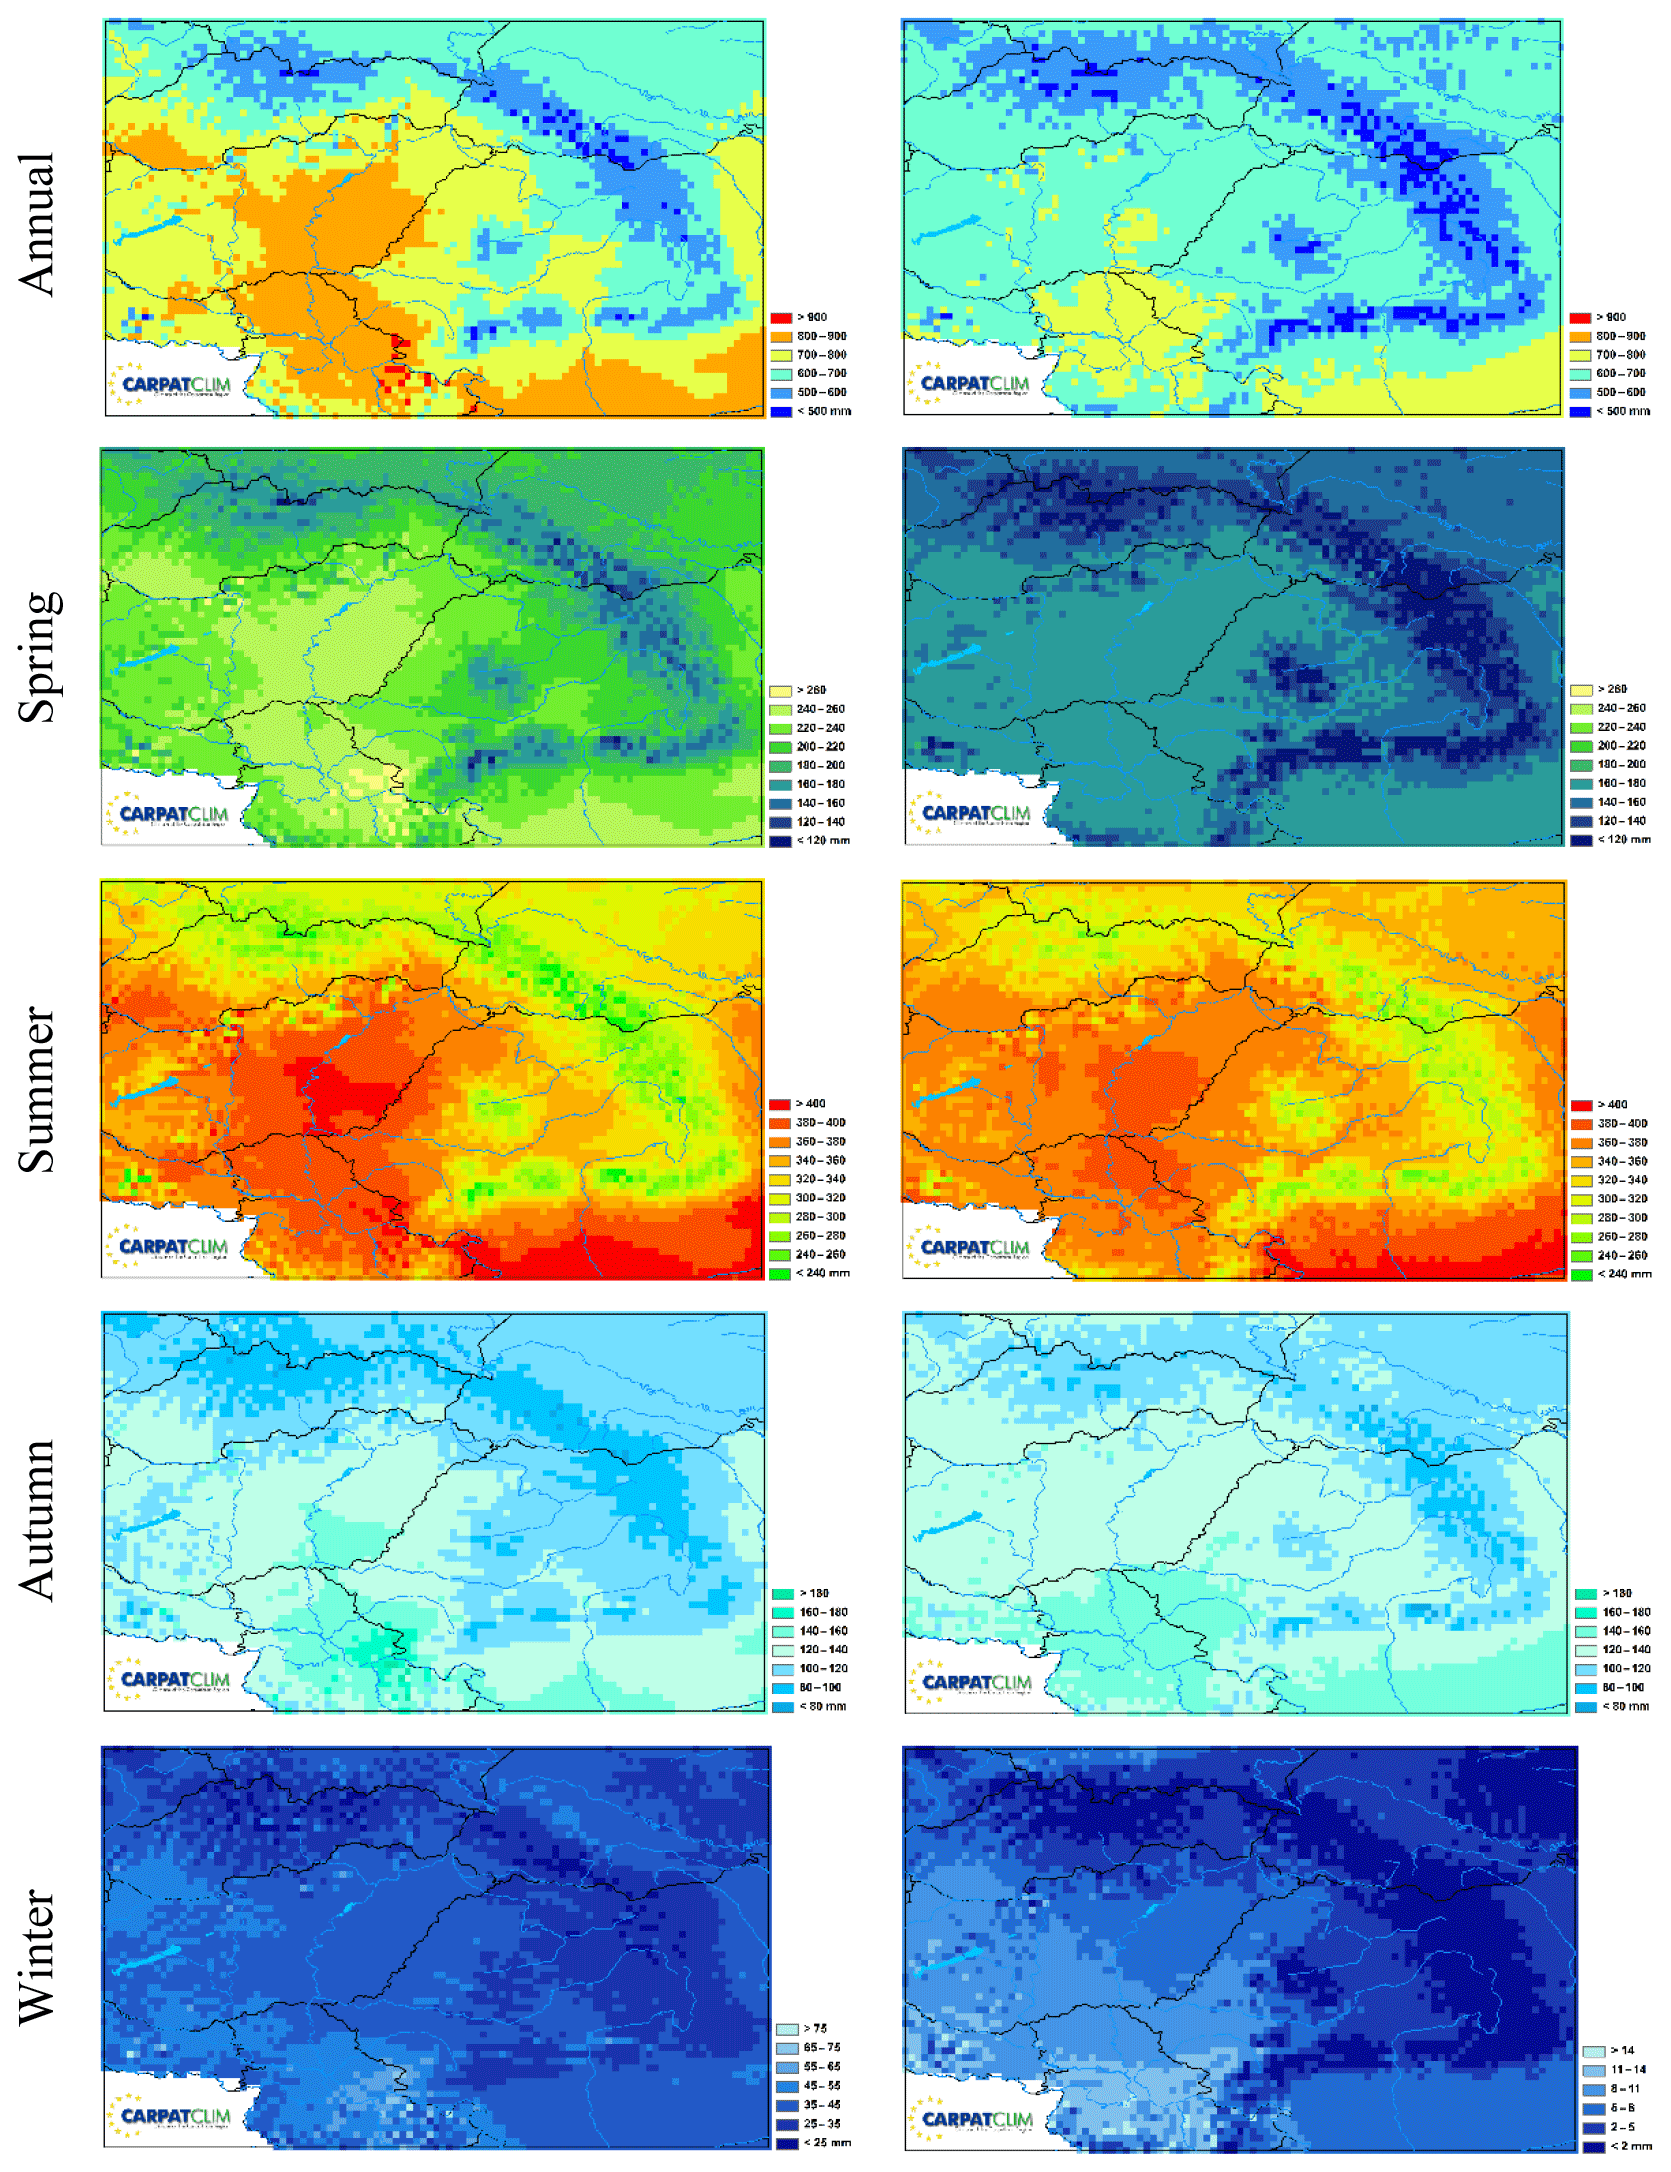
Figure 2Annual and seasonal averages of ET0 over the CarpatClim region from Penman–Monteith ET0 (left panels) and Thornthwaite estimates (PET_Th) (right panels) for the period 1961–2010.
Further measures of the comparison can be applied such as the relative bias (RE) and the root mean square error (RMSE). As the Penman–Monteith method is considered the most reliable method, the validation was made against that for each grid point on an annual basis. Similar comparisons can be found in Chen et al. (2005). Note that the biases and root mean square errors are normalized by the means of the Penman–Monteith estimates. These two error statistics give an averaged difference over the period 1961–2010. The annual bias indicates that the Thornthwaite method underestimates the potential evapotranspiration in the Carpathian Region (Fig. 3, left panel) relative to Penman–Monteith ET0. The lowland areas can be characterized by underestimation above 20 % over extended regions, while ∼4 % overestimation appear in a few gridpoints in the mountainous part of the domain. The right panel in Fig. 3 shows the distribution of annual relative RMSE. The annual relative RMSE ranges from 2.6 % to 31.7 % across the Carpathian region.

Figure 3Annual relative bias (%) (a) and RMSE (%) (b) of Thornthwaite estimates (PET_Th) compared with Penman–Monteith ET0 over the CarpatClim region for the period 1961–2010.
As PannEx focused on the Pannonian Basin we examined the annual cycle of both estimates for selected grid points at elevations lower than 200 m. The monthly averages are shown in the Fig. 4. The Penman–Monteith estimates substantially exceed the Thorthwaite estimates in winter and spring; but from August to October this relationship them reverses. The highest difference is 24 mm in April in favour of Penman–Monteith estimates. The average monthly underestimation from August to October is 4 mm.
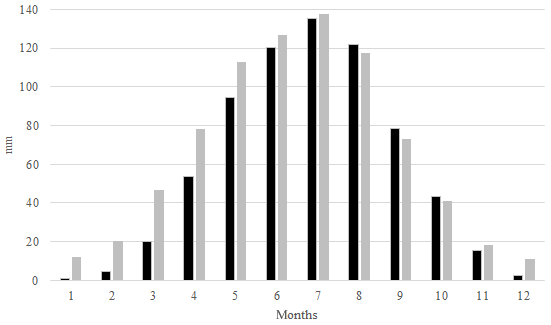
Figure 4The monthly averages of ET0 over the CarpatClim region from Penman–Monteith (grey shaded) and Thornthwaite estimates (PET_Th) (black shaded) in the Pannonian Basin at elevations lower than 200 m for the period 1961–2010.
Climate change influences all essential climate variables (Spinoni et al., 2015) in the Carpathian region, including the evaporative demand of the atmosphere. The slope of the fitted linear trend to the annual ET0 is presented in the Fig. 5. Areas with significant trends at α=0.1 significance level are marked with crosses on the map. The increasing trend in the ET0 is obvious in the Carpathian region from 1961 to 2010. Only small areas (depicted in blue) show decreasing but insignificant trend in these 50 years. The trend of the reference evapotranspiration ET0 is 0.868 mm yr−1 on average, resulting in a 42.5 mm increase from 1961 to 2010 in the Carpathian region. The highest change is close to 125 mm in flat areas in the north-west part of the region.

Figure 5The slope of the fitted linear trend (mm yr−1) to the annual of ET0 for the period 1961–2010. The significant trends at α=0.1 significance level are marked with stippling.
Penman–Monteith reference evapotranspiration (ET0) was computed on a daily scale for the CarpatClim grid for the period 1961–2010. One of our main results is that ET0 values are now available on a daily time step in the CarpatClim database for the applications in the region of the Pannonian Basin Experiment (PannEx). The classical Thornthwaite estimates (PET_Th) were compared on annual and seasonal bases for the 50-year period (1961–2010) to the Penman–Monteith estimates. Both estimates are influenced by geographical location and orographic features. The monthly ET0 dataset resulted in a more detailed spatial structure and provided higher values, especially in the winter, than the earlier calculated monthly PET_Th in CarpatClim. The annual timeseries are similar, but the spatially averaged annual values of ET0 are 80 mm higher than the Thornthwaite estimation (PET_Th). The annual relative bias indicates that the Thornthwaite method underestimates the Penman–Monteith estimates in the Carpathian Region, especially in the lowland. As the focus area of PannEx is Pannonian/Carpathian Basin, this is the reason why we examined the annual course of both estimates at elevations lower than 200 m. The highest difference is 24 mm in April in favour of Penman–Monteith estimates. The slope of the fitted linear trend to the annual averages of ET0 is also presented to illustrate the effect of recent climate change in the Carpathian basin and its surroundings. We can conclude that both methods are suitable for further investigations in the Carpathian region.
Evapotranspiration is a fundamental component of the hydrological cycle and is essential for understanding land-surface processes in climatology. This was the first step towards creating a realistic daily evaporation database, which is one of the tasks specified in the Science and Implementation plan of the PannEx project (Lakatos et al., 2018). For this purpose, more detailed soil and surface cover databases should be built and reliable soil moisture data (measured or calculated) will be needed (Breuer et al., 2012; Ács et al., 2015). The estimation of the components of the radiation balance will be followed by the parametrization of turbulent fluxes. The standard meteorological measurements of the Hungarian Meteorological Service and high-quality agrometeorological stations (see, for example, the Campbell Scientific products) also provide an opportunity for in situ reference evaporation (LE0) calculation. Another practical way for calculating reference (ET0) and/or potential evapotranspiration (based on different methods) is by using operative weather prediction model results (see for example the MEANDER nowcasting system based on the high resolution WRF model, Horváth et al., 2015). In practice, estimation of actual ET is often made by using information about potential evapotranspiration and soil moisture. In the future we are considering the development and verification of a unified methodology for derivation of the gridded energy budget components and soil moisture based on standard meteorological measurements and satellite information by using SVAT model approach for the CarpatClim grid system. Moreover, the further extension of the CarpatClim with land-use, soil type, albedo and soil moisture data could support future PannEx activities.
Daily Penman–Monteith reference evapotranspiration values based on CarpatClim dataset can be freely download from this link: https://www.met.hu/downloads.php?id=18&file=CARPATCLIM_PM_ET (last access: 19 February 2020).
ML prepared the manuscript with major contributions of TW, further contributions of AH, LH and ZB. ML and TW write the overview of scientific literature and developed the structure of the manuscript together with AH. ZB provided the database and background information of CarpatClim dataset. ML, LH calculated the reference evaporation and made the programming work further contributions of ML and ZB, ML and LH performed the statistical analysis. LH prepared the maps. All authors contributed to the results.
The authors declare that they have no conflict of interest.
This article is part of the special issue “18th EMS Annual Meeting: European Conference for Applied Meteorology and Climatology 2018”. It is a result of the EMS Annual Meeting: European Conference for Applied Meteorology and Climatology 2018, Budapest, Hungary, 3–7 September 2018.
The authors would like to thank the PannEx Regional Hydroclimate Project (RHP) and the Croatian-Hungarian bilateral scientific program TéT-16-0034 for the financial and scientific support of our research.
This paper was edited by Adina-Eliza Croitoru and reviewed by four anonymous referees.
Ács, F.: On twenty-first century climate classification, European multiregional analyses, Lambert Academic Publishing, Mauritius, 92 pp., ISBN 978-620-2-00302-5, 2017.
Ács, F., Breuer, H., and Szász, G.: Estimation of actual evapotranspiration and soil water content in the growing season, Agrokémia és Talajtan, 1st online edition, selected and revised English versions of Hungarian Agrokémia és Talajtan papers from 2000 to 2010, 60 Supplementum, 57–74, 2011.
Ács, F., Rajkai, K., Breuer, H., Mona, T., and Horváth, Á.: Soil-atmosphere relationships: The Hungarian perspective, Open Geosci., 1, 395–406, https://doi.org/10.1515/geo-2015-0036, 2015.
Allen, R. G., Pereira, L. S., Raes, D., and Smith, M.: Crop evapotranspiration – guidelines for computing crop water requirements, FAO Irrigation and drainage paper 56, FAO, Rome, 300, D05109, 1998.
Anon, J.: Proceeding of the informal meeting on physics in agriculture, Neth. J. Agric. Sci., 4, 1–162, 1956.
Bai, P., Liu, X., Liang, K., and Liu, C.: Comparison of performance of twelve monthly water balance models in different climatic catchments of China, J. Hydrol., 529, 1030–1040, https://doi.org/10.1016/j.jhydrol.2015.09.015, 2015.
Barik, M. G., Hogue, T. S., Franz, K. J., and Kinoshita, A. M.: Assessing Satellite and Ground-Based Potential Evapotranspiration for Hydrologic Applications in the Colorado River Basin, J. Am. Water Resour. Assoc., 52, 48–66, https://doi.org/10.1111/1752-1688.12370, 2016.
Breuer, H., Ács, F., Laza, B., Horváth, Á., Matyasovszky, I., and Rajkai, K.: Sensitivity of MM5-simulated planetary boundary layer height to soil dataset: Comparison of soil and atmospheric effects, Theor. Appl. Climatol., 109, 577–590, https://doi.org/10.1007/s00704-012-0597-y, 2012.
CarpatClim: Climate of the Carpathian Region, available at: http://www.carpatclim-eu.org/ (last access: 5 February 2020), 2020a.
CarpatClim: D2.5 – Report with final results of the data harmonization procedures applied, including all protocols, per country, available at: http://www.carpatclim-eu.org/pages/deliverables/ (last access: 5 February 2020), 2020b.
Ceglar, A., Croitoru, A.-E., Cuxart, J., Djurdjevic, V., Güttler, I., Ivančan-Picek, B., Jug, D., Lakatos, M., and Weidinger, T.: PannEx: The Pannonian Basin Experiment, Clim. Serv., 11, 78–85, https://doi.org/10.1016/j.cliser.2018.05.002, 2018.
Chen, D., Gao, G., Xu, C. Y., Guo, J., and Ren, G.: Comparison of the Thornthwaite method and pan data with the standard Penman–Monteith estimates of reference evapotranspiration in China, Clim. Res., 28, 123–132, https://doi.org/10.3354/cr028123, 2005.
Chervenkov, H., Slavov, K., and Ivanov, V.: STARDEX and ETCCDI Climate Indices Based on E-OBS and CarpatClim, in: Numerical Methods and Applications, Springer Nature Switzerland, edited by: Nikolov, G., Kolkovska, N., and Georgiev, K., Lect. Notes Comput. Sci., 11189, 360–367, https://doi.org/10.1007/978-3-030-10692-8_40, 2019.
Copernicus CCS: Copernicus Climate Change Service, available at: http://surfobs.climate.copernicus.eu/dataaccess/access_carpatclim.php, last access: 5 February 2020.
Currie, D. J.: Energy and large-scale patterns of animal- and plant-species richness, Am. Nat., 137, 27–49, 1991.
Cuxart, J. and Matjačić, B.: Operational atmospheric observational networks and special observations, in: GEWEX workshop on the climate system of the Pannonian-Basin, Faculty of Agriculture, University of Osijek, 9–11 November 2015, Osijek, available at: http://meteo.hr/PANNEX_2015/index.php?id=programme (last access: 5 February 2020), 2015.
Dyck, S.: Overview on the present status of the concepts of water balance models, in: Proceedings of Hamburg Workshop on New Approaches in Water Balance Computations, edited by: Van der Beken, A. and Herrmann, A., IAHS Publ., 148, 3–19, 1983.
Fisher, J. B., DeBiase, T. A., Qi, Y., Xu, M., and Goldstein, A. H.: Evapotranspiration methods compared on a Sierra Nevada 2 forest ecosystem, Environ. Model. Softw., 20, 783–796, https://doi.org/10.1016/j.envsoft.2004.04.009, 2005.
Fisher, J. B., Whittaker, R. J., and Malhi, Y.: ET come home: potential evapotranspiration in geographical ecology, Global Ecol. Biogeogr., 20, 1–18, https://doi.org/10.1111/j.1466-8238.2010.00578.x, 2011.
GEWEX: The Global Energy and Water Cycle Experiment, available at: https://www.gewex.org/, last access: 5 February 2020.
Haas, J., Nagymarosy, A., and Hámor, G.: Genesis and Evolution of the Pannonian Basin, in: Geology of Hungary, Regional Geology Reviews, edited by: Haas, J., Springer, Berlin, Heidelberg, ISBN 978-3-642-21910-8, 2013.
Horváth, Á., Nagy, A., Simon, A., and Németh, P.: MEANDER: The objective nowcasting system of the Hungarian Meteorological Service, Időjárás, 119, 197–213, 2015.
Katerji, N. and Rana, G.: Crop Reference Evapotranspiration: A Discussion of the Concept, Analysis of the Process and Validation, Water Resour. Manage., 25, 1581–1600, https://doi.org/10.1007/s11269-010-9762-1, 2011.
Lakatos, M., Szentimrey, T., Bihari, Z., and Szalai, S.: Creation of a homogenized climate database for the Carpathian region by applying the MASH procedure and the preliminary analysis of the data, Időjárás, 117, 143–158, 2013.
Lakatos, M., Weidinger, T., Horváth, Á., Hoffmann, L., Bihari, Z., Szentimrei, T., and Cuxart, J.: Computation of PET on daily scale to estimate the surface energy budget components in the region of the PannEx RHP, in: 8th GEWEX Open Science Conference: Extremes and Water on the Edge, 6–11 May 2018, Canmore, Alberta, Canada, available at: https://www.gewexevents.org/wp-content/uploads/Website_S2_1500-canmore_pannex_et.pdf (last access: 5 February 2020), 2018.
Lang, D., Zheng, J., Shi, J., Liao, F., Ma, X., Wang, W., Chen, X., and Zhang, M.: A Comparative Study of Potential Evapotranspiration Estimation by Eight Methods with FAO Penman–Monteith Method in Southwestern China, Water, 9, 734, https://doi.org/10.3390/w9100734, 2017.
Matenco, L. and Radivojević, D.: On the formation and evolution of the Pannonian Basin: Constraints derived from the structure of the junction area between the Carpathians and Dinarides, Tectonics, 31, TC6007, https://doi.org/10.1029/2012TC003206, 2012.
McMahon, T. A., Peel, M. C., Lowe, L., Srikanthan, R., and McVicar, T. R.: Estimating actual, potential, reference crop and pan evaporation using standard meteorological data: a pragmatic synthesis, Hydrol. Earth Syst. Sci., 17, 1331–1363, https://doi.org/10.5194/hess-17-1331-2013, 2013.
Mihic, D., Spinoni, J., and Antofie, T.: Final report on the production of the climatology of the Carpathian Region, Final report, CARPATCLIM, p. 17, available at: http://www.carpatclim-eu.org/docs/deliverables/D3_7.pdf (last access: 5 February 2020), 2013.
Nistor, M.-M., Gualtieri, A. F., Cheval, S., Dezsic, S., and Bótan, V. E.: Climate Change Effects on Crop Evapotranspiration in the Carpathian Region from 1961 to 2010, Meteorol. Appl., 23, 462–469, https://doi.org/10.1002/met.1570, 2016.
Niu, G.-Y., Yang, z.-L., Mitchell, K. E., Chen, F., Ek, M. B., Barlage, M., Kumar, A., Manning, K., Niyogi, D., Rosero, E., Tewari, M., and Xia, Y.: The community Noah land surface model with multiparameterization options (Noah-MP): 1. Model description and evaluation with local-scale measurements, J. Geophys. Res. 116, D12109, https://doi.org/10.1029/2010JD015139, 2011.
Olefs, M., Schöner, W., Suklitsch, M., Wittmann, C., Niedermoser, B., Neururer, A., and Wurzer, A.: SNOWGRID – A new operational snow cover model in Austria, in: International Snow Science Workshop, Grenoble, Chamonix Mont-Blanc, 038–045, 2013.
PannEx White Book: A GEWEX Regional Hydroclimate Project (RHP) over the Pannonian Basin (2019), WCRP Report 3/2019, World Climate Research Programme (WCRP), Geneva, Switzerland, 108 pp., 2019.
PannEx: The Pannonian Basin Experiment, available at: https://sites.google.com/site/projectpannex/, last access: 5 February 2020.
Penman, H. L.: Natural evaporation from open water, bare soil and grass, P Roy. Soc. Ser. A, 193, 120–146, https://doi.org/10.1098/rspa.1948.0037, 1948.
Pieczka, I., Pongrácz, R., Szabóné André, K., Kelemen, F. D., and Bartholy, J.: Sensitivity analysis of different parameterization schemes using RegCM4.3 for the Carpathian region, Theor. Appl. Climatol., 130, 1175–1188, https://doi.org/10.1007/s00704-016-1941-4, 2017.
Rao, L. Y., Sun, G., Ford, C. R., and Vose, J. M.: 2011: Modeling Potential Evapotranspiration of Two Forested Watersheds in the Southern Appalachians, Am. Soc. Agric. Biol. Eng., 54, 2067–2078, 2011.
Rácz, C. S., Nagy, J., and Dobos, A. C. S.: Comparison of Several Methods for Calculation of Reference Evapotranspiration, Acta Silv. Lign. Hung., 9, 9–24, https://doi.org/10.2478/aslh-2013-0001, 2013.
Rey, J. M.: Modelling potential evapotranspiration of potential vegetation, Ecol. Model., 123, 141–159, https://doi.org/10.1016/S0304-3800(99)00129-5, 1999.
Sellinger, C. E., Computer program for estimating evapotranspiration using the Thornthwaite method, November 1996, NOAA Technical Memorandum ERL GLERL-101, Great Lakes Environmental Research Laboratory, Ann Arbor, Michigan, 9 pp., 1996.
Seneviratne, S. I., Lüthi, D., Litschi, M., and Schär, C.: Land–atmosphere coupling and climate change in Europe, Nature, 443, 205–209, https://doi.org/10.1038/nature05095, 2006.
Sepulcre-Canto, G., Vogt, J., Arboleda, A., and Antofie, T.: Assessment of the EUMETSAT LSA-SAF evapotranspiration product for drought monitoring in Europe, Int. J. Appl. Earth Obs. Geoinform., 30, 190–202, https://doi.org/10.1016/j.jag.2014.01.021, 2014.
Spinoni, J., Antofie, T., Barbosa, P., Bihari, Z., Lakatos, M., Szalai, S., Szentimrey, T., and Vogt, J.: An overview of drought events in the Carpathian Region in 1961–2010, Adv. Sci. Res., 10, 21–32, https://doi.org/10.5194/asr-10-21-2013, 2013.
Spinoni, J., Szalai, S., Szentimrey, T., Lakatos, M., Bihari, Z., Nagy, A., Németh, Á., Kovács, T., Mihic, D., Dacic, M., Petrovic, P., Kržic, A., Hiebl, J., Auer, I., Milkovic, J.,Štepánek, P., Zahradnícek, P., Kilar, P., Limanowka, D., Pyrc, R., Cheval, S., Birsan, M.V., Dumitrescu, A., Deak, G., Matei, M., Antolovic, I., Nejedlík, P., ŠtastnÃ!`, P., Kajaba, P., Bochnícek, O., Galo, D., Mikulová, K., Nabyvanets, Y., Skrynyk, O., Krakovska, S.,Gnatiuk, N., Tolasz, R., Antofie, T., and Vogt, J.: Climate of the Carpathian Region in the period 1961–2010: climatologies and trends of 10 variables, Int. J. Climatol., 35, 1322–1341, https://doi.org/10.1002/joc.4059, 2015.
Szalai, S. and Vogt, J.: CARPATCLIM – high resolution gridded database of the Carpathian Region and calculation of drought indices as a contribution to the European Drought Observatory, in: WRCP Conference, 24–28 October 2011, Denver, USA, T185A, 2011.
Szentimrey, T.: Multiple Analysis of Series for Homogenization (MASH), in: Proceedings of the Second Seminar for Homogenization of Surface Climatological Data, WMO, WCDMP-No. 41, Budapest, Hungary, 27–46, 1999.
Szentimrey, T.: Manual of homogenization software MASHv3.03, Hungarian Meteorological Service, Budapest, Hungary, 64 pp., 2011.
Szentimrey, T.: Final version of gridded datasets of all harmonized and spatially interpolated meteorological parameters, per country, Final report, CARPATCLIM, p. 225, available at: http://www.carpatclim-eu.org/docs/deliverables/D2_8.pdf (last access: 5 February 2020), 2012.
Szentimrey, T. and Bihari, Z.: Mathematical background of the spatial interpolation methods and the software MISH (Meteorological Interpolation based on Surface Homogenized Data Basis), in: Proceedings from the Conference on Spatial Interpolation in Climatology and Meteorology, 2004, COST Action 719, COST Office, Budapest, Hungary, 17–27, 2007.
Thornthwaite, C. W.: An approach toward a rational classi?cation of climate, Geogr. Rev., 38, 55–94, 1948.
Torma, C.: Detailed validation of EURO-CORDEX and Med-CORDEX regional climate model ensembles over the Carpathian Region, Időjárás, 123, 217–240, https://doi.org/10.28974/idojaras.2019.2.6, 2019.
Torma, Cs., Coppola, R., Giorgi, F., Bartholy, J., and Pongrácz, R.: Validation of a High-Resolution Version of the Regional Climate Model RegCM3 over the Carpathian Basin, J. Hydrometeorol., 12, 84–100, https://doi.org/10.1175/2010JHM1234.1, 2011.
Vicente-Serrano, S. M., Beguería, S., and López-Moreno, J. I.: A Multiscalar Drought Index Sensitive to Global Warming: The Standardized Precipitation Evapotranspiration Index, J. Climate, 23, 1696–1718, https://doi.org/10.1175/2009JCLI2909.1, 2010.
Westerhoff, R. S.: Using uncertainty of Penman and Penman–Monteith methods incombined satellite and ground-based evapotranspiration estimates, Remote Sens. Environ., 169, 102–112, https://doi.org/10.1016/j.rse.2015.07.021, 2015.
Ziese, M., Schneider, U., Meyer-Christoffer, A., Schamm, K., Vido, J., Finger, P., Bissolli, P., Pietzsch, S., and Becker, A.: The GPCC Drought Index – a new, combined and gridded global drought index, Earth Syst. Sci. Data, 6, 285–295, https://doi.org/10.5194/essd-6-285-2014, 2014.
Zotarelli, L., Dukes, M. D., Romero, C. C., Migliaccio, K. W., and Morgan, K. T.: Step by Step Calculation of the Penman–Monteith Evapotranspiration (FAO-56 Method), IFAS Extension, University of Florida, Florida, available at: http://edis.ifas.ufl.edu (last access: 5 February 2020), 2010.
- Abstract
- Introduction
- The CarpatClim dataset
- Daily ET0 derived by Penman–Monteith reference evapotranspiration method
- Comparison of the Penman–Monteith ET0 and Thornthwaite estimates for CarpatClim dataset
- Concluding remarks and future plans
- Data availability
- Author contributions
- Competing interests
- Special issue statement
- Acknowledgements
- Review statement
- References