 | 13 Aug 2019
Regionally improved seasonal forecast of precipitation through Best estimation of winter NAO
Eroteida Sánchez-García
José Voces-Aboy
Beatriz Navascués
Ernesto Rodríguez-Camino
We describe a methodology for ensemble member's weighting of operational seasonal forecasting systems (SFS) based on an enhanced prediction of a climate driver strongly affecting meteorological parameters over a certain region. We have applied it to the North Atlantic Oscillation (NAO) influence on the Iberian Peninsula winter precipitation.
The first step in the proposed approach is to find the best estimation of winter NAO. Skill and error characteristics of forecasted winter NAO index by different Copernicus SFS are analysed in this study. Based on these results, a bias correction scheme is proposed and implemented for the ECMWF System 5 ensemble mean of NAO index, and then a modified NAO index pdf based on Gaussian errors is formulated. Finally, we apply the statistical estimation theory to achieve the Best linear unbiased estimate of winter NAO index and its uncertainty. For this purpose, two a priori estimates are used: the bias corrected NAO index Gaussian pdf from ECMWF System 5, and a skilful winter NAO index prediction based on teleconnection with snow cover advance with normal distributed errors.
The second step of the proposed methodology is to employ the enhanced NAO index pdf estimates for ensemble member's weighting of a SFS based on a single dynamical model. The new NAO pdfs obtained in this work have been used to improve the skill of the ECMWF System 5 to predict both NAO index and precipitation over the Iberian Peninsula. We show the improvement of NAO prediction, and of winter precipitation forecasts over our region of interest, when members are weighted with the bias corrected NAO index Gaussian pdf based on ECMWF System 5 compared with the usual approach based on equiprobability of ensemble members. Forecast skill is further enhanced if the Best NAO index pdf based on an optimal combination of the two a priori NAO index estimates is used for ensemble member's weighting.
- Article
(1461 KB) - Full-text XML
- BibTeX
- EndNote


In this study we present a methodology for ensemble member's weighting of operational seasonal forecasting systems (SFSs) based on the extent that certain climate variables (e.g. temperature, precipitation) are captured by a driver of climate variability, as e.g., the North Atlantic Oscillation (NAO). The role of the NAO as main climate driver influencing winter precipitation over the Iberian Peninsula area is well known (e.g. Rodríguez-Puebla et al., 1998). Based on this fact, we describe and apply a new developed methodology aiming at improving NAO and total precipitation seasonal forecasts for the extended winter (November to March, NDJFM) over this geographical area. It makes use of the predictability associated to this climate variability pattern by assigning a different weight to each ensemble member of a particular operational SFS according to its forecasted winter NAO index.
The first step in the proposed approach is to find the best estimation of winter NAO. Although operational SFSs have until very recently little or no skill in European mid-latitudes for precipitation, some authors have recently started to report that some SFSs based on dynamical models show remarkable skill in predicting winter NAO or the related Arctic Oscillation (AO) (e.g., Riddle et al., 2013; Scaife et al., 2014; Kang et al., 2014; Stockdale et al., 2015; Athanasiadis et al., 2017). It is recognised that interannual variability of the winter NAO is driven by a combination of different external sources and dynamical mechanisms. Among these sources of predictability, it is snow cover extent. Cohen and Jones (2011) have shown that, part of NAO wintertime variability, may be externally forced by the autumn boreal snow cover advance. This permits some predictability with one-month lead time or more using simple statistical predictions based on single predictors. Although dynamical SFSs are able to simulate various existing sources of predictability, their forecasts skill frequently do not overcome those of statistical systems, due to climate models difficulties to adequately reproduce important processes.
Athanasiadis et al. (2017) obtain an enhanced skill of winter NAO forecasts through the combination of three different operational SFSs, giving the same weight to each system. In this work we combine weighted forecasts of winter NAO from different forecasting systems coming mostly, but not only, from SFSs based on dynamical models. Our approach attempts to find the optimal (in a statistical sense) NAO estimate following, in a simplified way, methods used in data assimilation for determining atmospheric initial conditions in Numerical Weather Prediction (NWP).
In order to do so, some error statistical characteristics of wintertime NAO simulated by different forecasting systems must be previously known. The existence of biases of the SFS ensemble mean of NAO index with comparable magnitude to the interannual anomaly signal is a serious hindrance that must be circumvented. Consequently, biases should be corrected before or within the algorithm using the estimates, as it is routinely done in NWP, e.g. with satellite radiances (Eyre, 2016). Knowledge of error variances for different a priori NAO index estimates is another requirement of optimal estimation method. The distribution of NAO index forecasts by the ensemble members around the ensemble mean NAO is provided by the SFS itself. So, the variance of the NAO index forecast each winter can be obtained from the ensemble spread. In this sense, if this SFS ensemble spread is not realistic as a measure of the NAO index estimate error, error variance of the ensemble mean NAO index may be alternatively modelled. Finally, statistical estimation theory (e.g. Kalnay, 2003) allows to obtain an optimal (Best) linear estimation of winter NAO index and its uncertainty (i.e. an optimal NAO pdf) based on a priori NAO index estimates and their respective error variances. The algorithm is based on minimising the error variance of the optimal estimate. In case of Gaussian error distributions of the a priori estimates, the method is equivalent to the maximum likelihood Bayesian approach followed, e.g. by Coelho and Pezzulli (2004) to estimate ENSO index seasonal forecast distribution.
We analyse the performance of winter NAO (December to February) seasonal forecasts by three different SFS available at the Climate Data Store (CDS) of the Copernicus Climate Change Service (C3S). Ensemble mean of NAO index correlation with observations and NAO index ensemble spread measured as the NAO index variance or standard deviation are calculated. Error histograms and RMSE of these SFS ensemble mean NAO forecasts are also obtained and spread/RMSE ratios are computed. Then, a statistical bias correction scheme is formulated and successfully applied to the SFS showing the highest correlation with observations.
An empirical seasonal forecasting system (named S-ClimWaRe) relying on the October snow advance over continental areas in the Northern Hemisphere and NAO relationship has been developed at AEMET (Voces et al., 2016). The S-ClimWaRe empirical system uses as predictor the Snow Advance Index (SAI) (Cohen and Jones, 2011). SAI is based on daily satellite snow cover data from the Interactive Multisensor Snow and Ice Mapping System (IMS), which generates daily maps of snow, and ice cover derived from visible and microwave satellite imagery (Ramsay, 1998; Helfrich et al., 2007). A NAO index forecast pdf is built using a normal distribution centered at the linearly regressed NAO index value with standard deviation obtained from the regression residuals. In this study, NAO index forecast errors from the S-ClimWaRe system have been analysed in a similar way to those of the three C3S SFSs.
Athanasiadis et al. (2017) largely attribute the high predictive skill for NAO achieved by the multisystem created by averaging three operational SFSs to the increase of the ensemble size (and then the seasonal signal), but also partly to increasing model diversity (due to cancellation of model errors). Unlike Athanasiadis et al. (2017), in our approach we do not increase the ensemble size but only consider the potential benefit brought by increasing model diversity. Among the seasonal forecasting systems analysed, we select for combination the two systems showing the highest NAO forecast performance in terms of biases and correlation with observations. The two a priori estimates selected in this work for applying optimal estimation theory and obtaining the Best NAO estimate pdf are: (i) the ensemble mean of NAO index forecasts from the bias corrected ECMWF S5 SFS,and (ii) the NAO index empirically predicted by the S-ClimWaRe system.
The second step of the methodology proposed in this paper relies on the knowledge of an enhanced winter NAO forecast pdf to weight members of a SFS based on a single dynamical model in order to achieve improved seasonal forecasts. Ensemble members' equiprobability is generally assumed for atmospheric members in SFSs based on a single dynamical model. Weighting of members from an ensemble seasonal forecasting system is not a trivial task and frequently depends on the particular application or target region of the forecast. Riddle et al. (2013) obtained slightly improved AO predictions with a single SFS when they use a weighted ensemble that rewards forecast runs that represent more accurately the Eurasian October snow cover extent. Dobrynin et al. (2018) enhance prediction skill of surface temperature, precipitation and sea level pressure over certain areas in the Northern Hemisphere by retaining only SFS ensemble members whose NAO state is close to a NAO empirical prediction. In our approach, we look for an enhanced precipitation pdf forecast over the Iberian Peninsula produced by an improved NAO pdf forecast. Instead of considering an ensemble sub-sampling, we apply an analytical function of winter NAO index to weight each SFS ensemble member. The weighting function used is the Gaussian NAO index pdf estimate that has been obtained by, either a bias correction procedure of the raw SFS NAO ensemble mean forecast, or an optimal estimation method combining different NAO index forecasts estimates. For a given ensemble member, the resulting member weight assigned depends on the member predicted NAO. So, it is expected that the member's weighting consistently improve the forecasting system skill in predicting both the winter NAO, and precipitation over those areas strongly influenced by this climate driver. Seasonal forecasts of NAO index and of accumulated precipitation for the extended winter over the Iberian Peninsula (NDJFM) are assessed (in a hindcast period) comparing skill of the SFS ensemble using both weighted and customary unweighted ensemble members.
This paper is structured as follows: Sect. 2 describes some errors statistical characteristics of seasonal forecast systems predicting the winter NAO. The methodology applied to improve the NAO estimates is presented in Sect. 3. The enhancement of NAO index prediction and precipitation forecast skill of a single SFS using weighted ensemble members based on two different NAO pdf estimates is shown in Sect. 4. Finally, Sect. 5 concludes with summary and final remarks.
The study has been carried only with seasonal forecasts initialized in October. The three operational C3S SFSs here analysed are ECMWF System 5, Met Office System 12 and Météo-France System 5 (https://cds.climate.copernicus.eu, Climate Data Store, 2019). As mentioned, the performance of S-ClimWaRe empirical seasonal forecasting system developed at AEMET is also considered.
ERA-Interim (ERAI) reanalysis (Dee et al., 2011) has been used to obtain EOF patterns and winter NAO index (averaged over December to February, DJF) time series similarly to Butler et al. (2016). For each of the three SFS considered and for each of their ensemble members, NAO index has been obtained by projecting the 1st EOF onto the member DJF averaged Z500 gridded anomaly. Notice that NAO index has not been standardized. Time series of the winter NAO index of the SFS ensemble has been compared to that of ERAI. Figure 1a shows a scatter plot of forecasted winter NAO index computed for ensemble members and ensemble mean from ECMWF System 5 against the corresponding winter NAO index value obtained from ERAI reanalysis. Regression line in Fig. 1a indicates that the ensemble mean of NAO index and ERAI are correlated. However, it can be seen the great dispersion of winter NAO index predicted each year by ensemble members and, as a consequence, that the magnitude of the ensemble mean of NAO index is underestimated and does not reproduce the amplitude of the observed North Atlantic Oscillation. Stockdale et al. (2015) also report a winter AO index highly correlated with observations but with a weak interannual AO signal in the formerly operational ECMWF System 4 SFS due the high degree of intraensemble spread in the ensemble members. Figure 1b compares ECMWF System 5 winter NAO index ensemble mean forecast error (using ERAI NAO indices as reference) with NAO ensemble variance. It shows that there is a correlation between ECMWF System 5 ensemble variance and ensemble mean bias (R=0.37). Figure 1b also shows that the size of the absolute error of the ensemble mean of NAO index predicted by ECMWF System 5 is not correlated with the NAO index intraensemble variance.
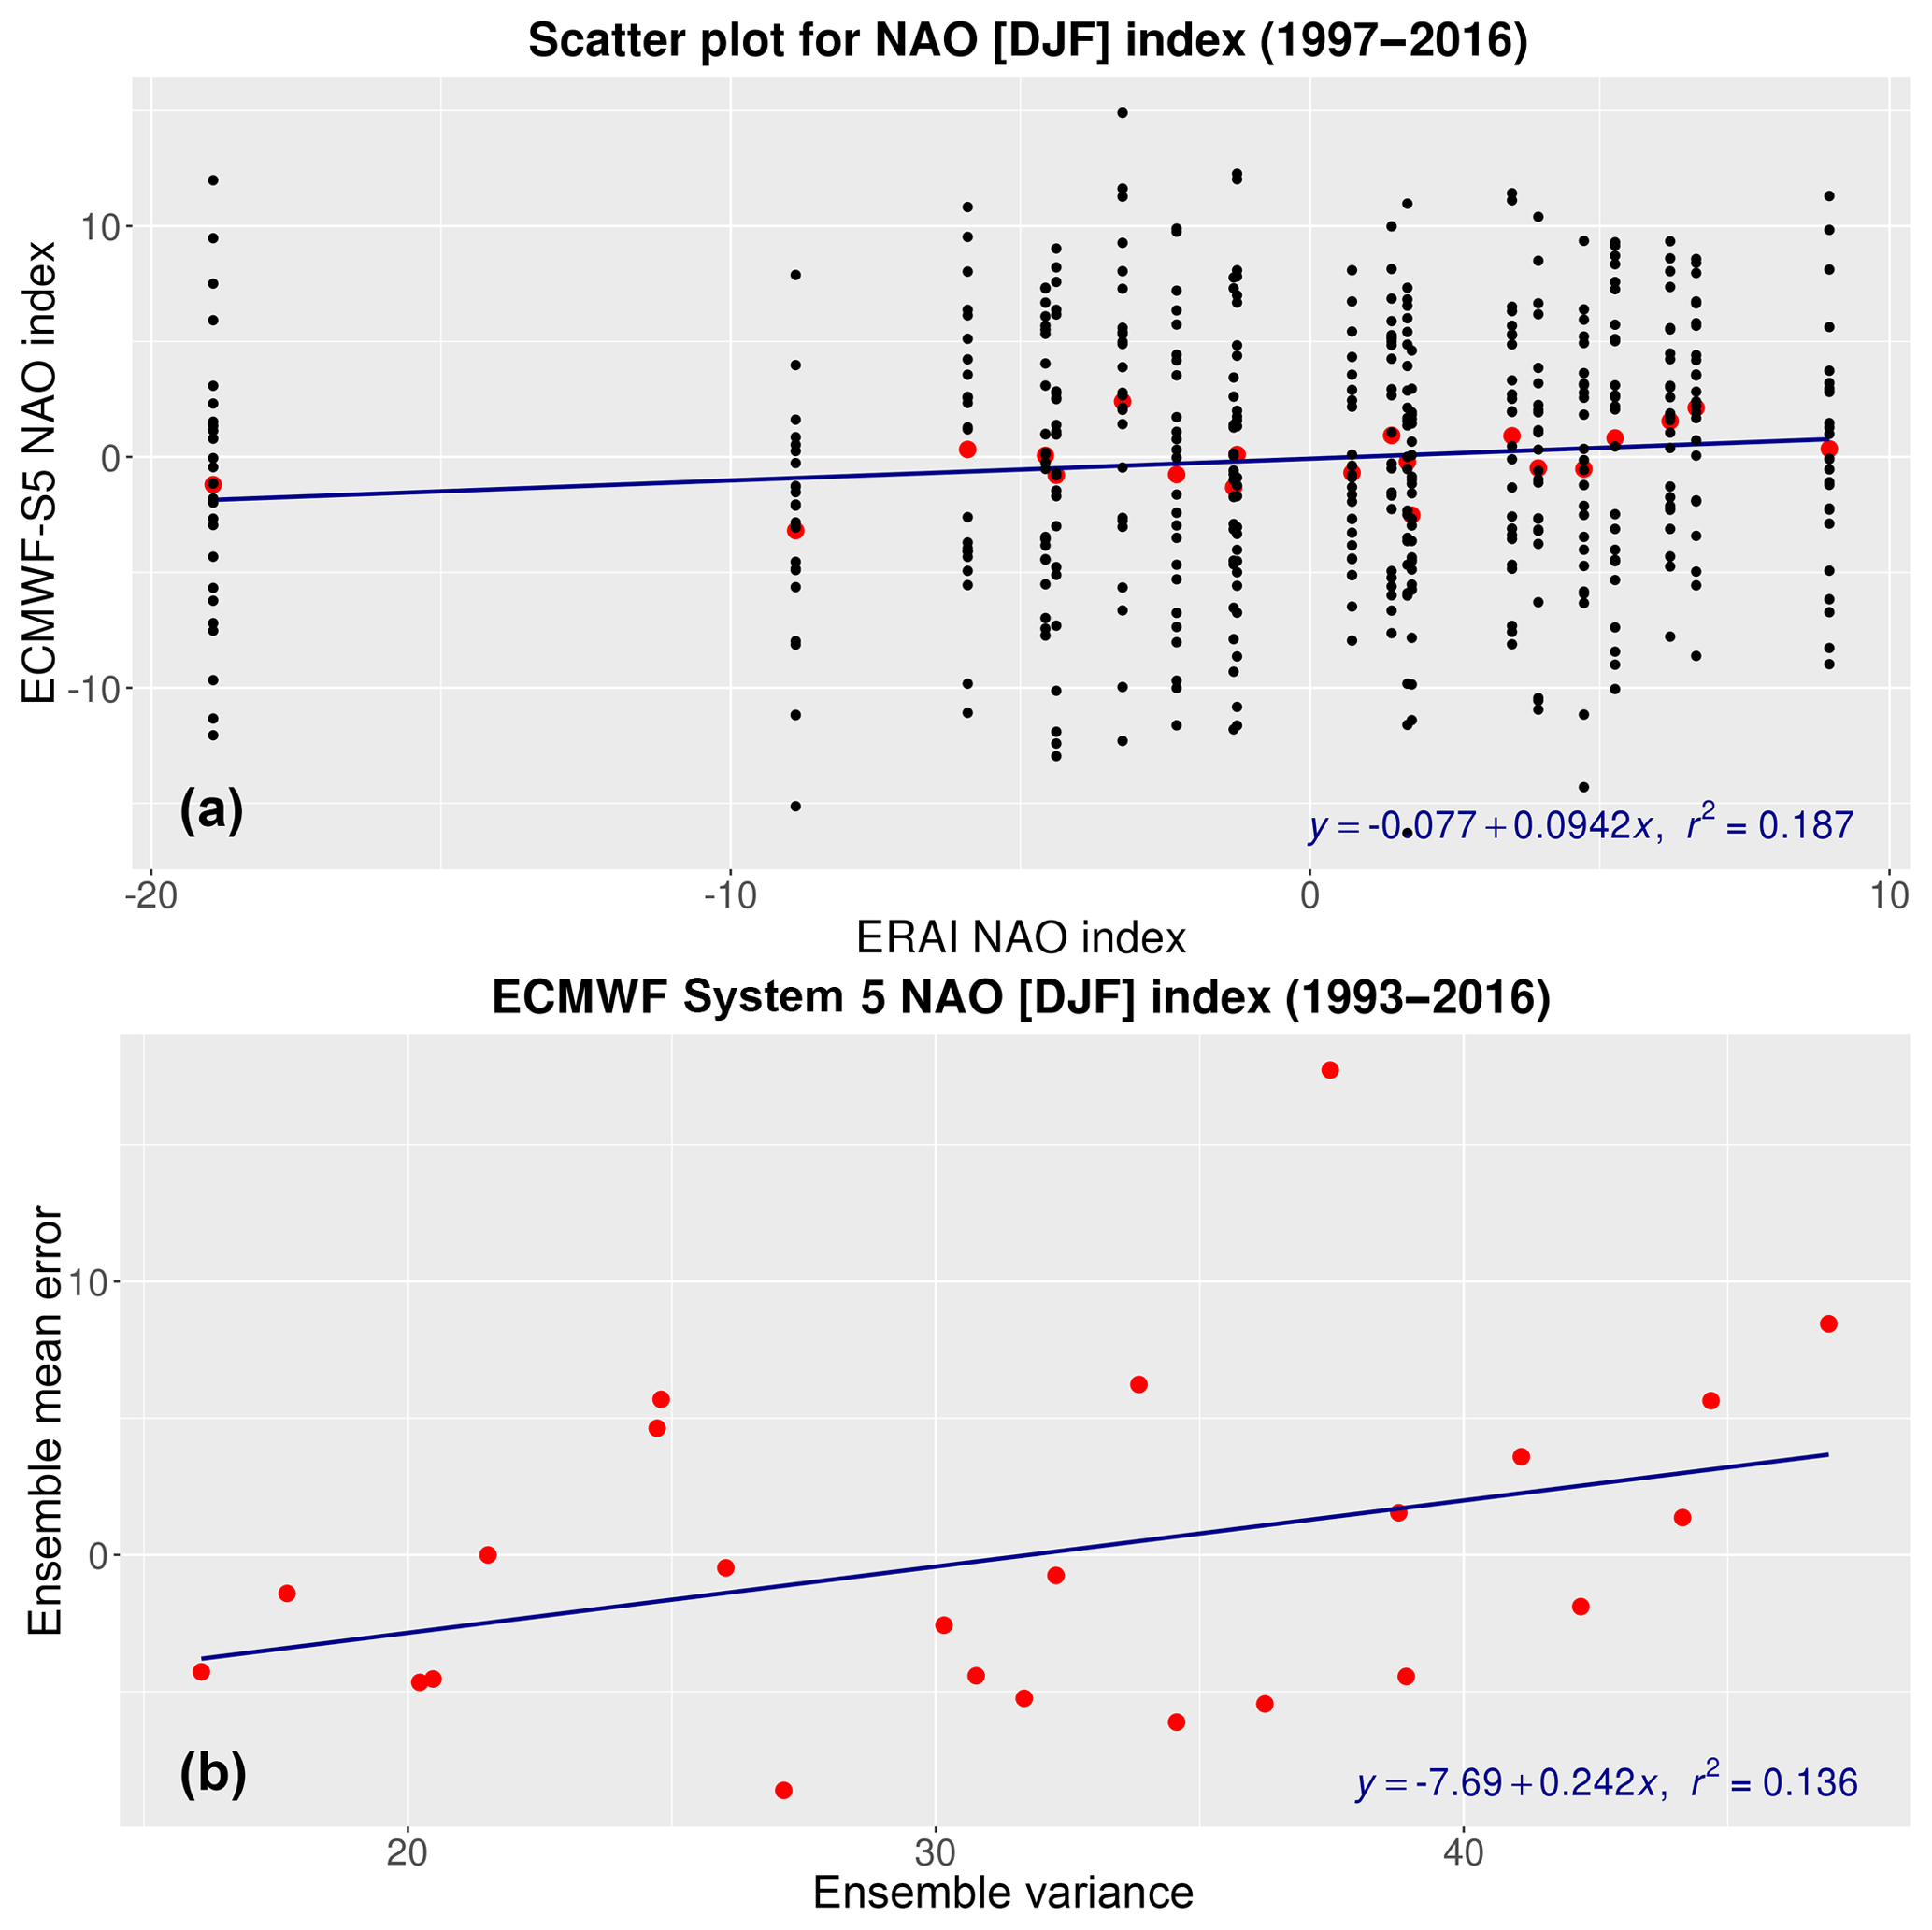
Figure 1(a) Scatter plot of the winter NAO [DJF] index (averaged over December–February) predicted each year between 1997–2016 by all the 25 ECMWF System 5 ensemble members (black dots) and by the ensemble mean (red dots), versus the NAO [DJF] index obtained from ERA-Interim reanalysis for the corresponding year. NAO [DJF] index forecasts have been computed from ECMWF System-5 initialized in October. Horizontal axis represents the range of values of the NAO [DJF] index obtained from ERA-Interim, whereas the y-axis represents the corresponding values of NAO [DJF] index predicted by ECMWF System-5 ensemble members and by the ensemble mean. The fitted regression line (in blue) of NAO [DJF] index predicted by ECMWF System-5 ensemble mean versus that obtained from ERA-Interim reanalysis is plotted in the figure. (b) ECMWF System 5 NAO [DJF] index ensemble mean error (on the y-axis) plotted versus NAO [DJF] index ensemble variance (on the x-axis) each year for the full hindcast period available (1993–2016). Error of the NAO [DJF] index predicted by ECMWF System-5 is calculated each year by subtracting the corresponding index obtained from ERA-Interim reanalysis for the same year. The fitted regression line (in blue) is plotted in the figure.
Some verification scores have been obtained to assess the performance of the different SFSs and S-ClimWaRe empirical system to predict the winter NAO. Correlation coefficient between winter NAO index computed from ensemble mean forecasts and from ERAI reanalysis is displayed in Table 1. In order to have a spread/skill evaluation of NAO seasonal forecasts, the ensemble spread each year has been calculated as the intraensemble standard deviation of NAO index. Its average over the hindcast period has been compared to Root Mean Square Error (RMSE) of the NAO index ensemble mean. Table 1 displays the corresponding spread/RMSE ratios for all SFSs analysed. The hindcast common period for the whole NAO error characterization is restricted to 1997–2016 due to the limited availability of S-ClimWaRe input satellite snow cover products. Over this hindcast period, only the ensemble mean of ECMWF System 5 and S-ClimWaRe present a significant correlation with ERA-Interim. However, ECMWF System 5 ensemble is overdispersive according to the spread/RMSE ratio, and the ensemble spread of NAO index largely overestimates the real ensemble mean error. On the contrary, Met Office System 12 ensemble is reliable (spread/RMSE ratio is close to 1), the observed error standard deviation of the ensemble mean of NAO index is well represented by the ensemble spread, but it presents a poor correlation with NAO index obtained from ERAI. Météo-France system 5 correlation with ERAI is low and it is underconfident as ECMWF System 5. S-ClimWaRe empirical system shows to be rather consistent in respect to spread/RMSE ratio (see Table 1)
Table 1Table showing correlation coefficient between winter NAO index (averaged over December–February) computed from ensemble mean forecasts and from ERA Interim re-analysis for a selection of models initialized in October covering the period 1997–2016. Ratio of NAO index ensemble spread and RMSE of the ensemble mean of NAO index is also shown for the period 1997–2016, excluding the extreme NAO 2009/2010 year.
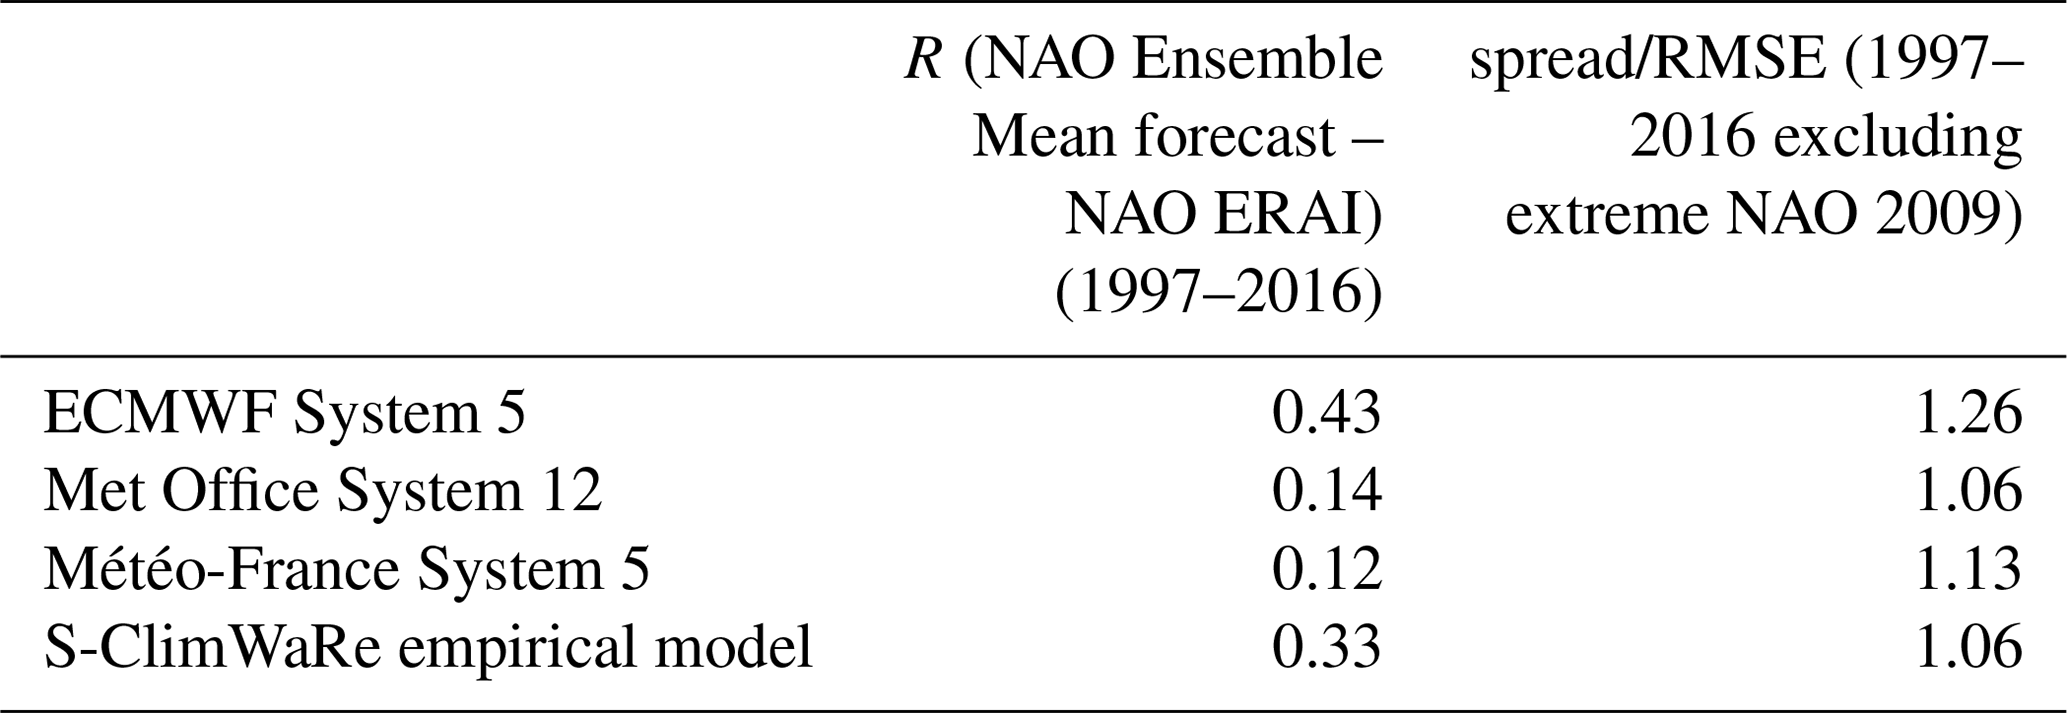
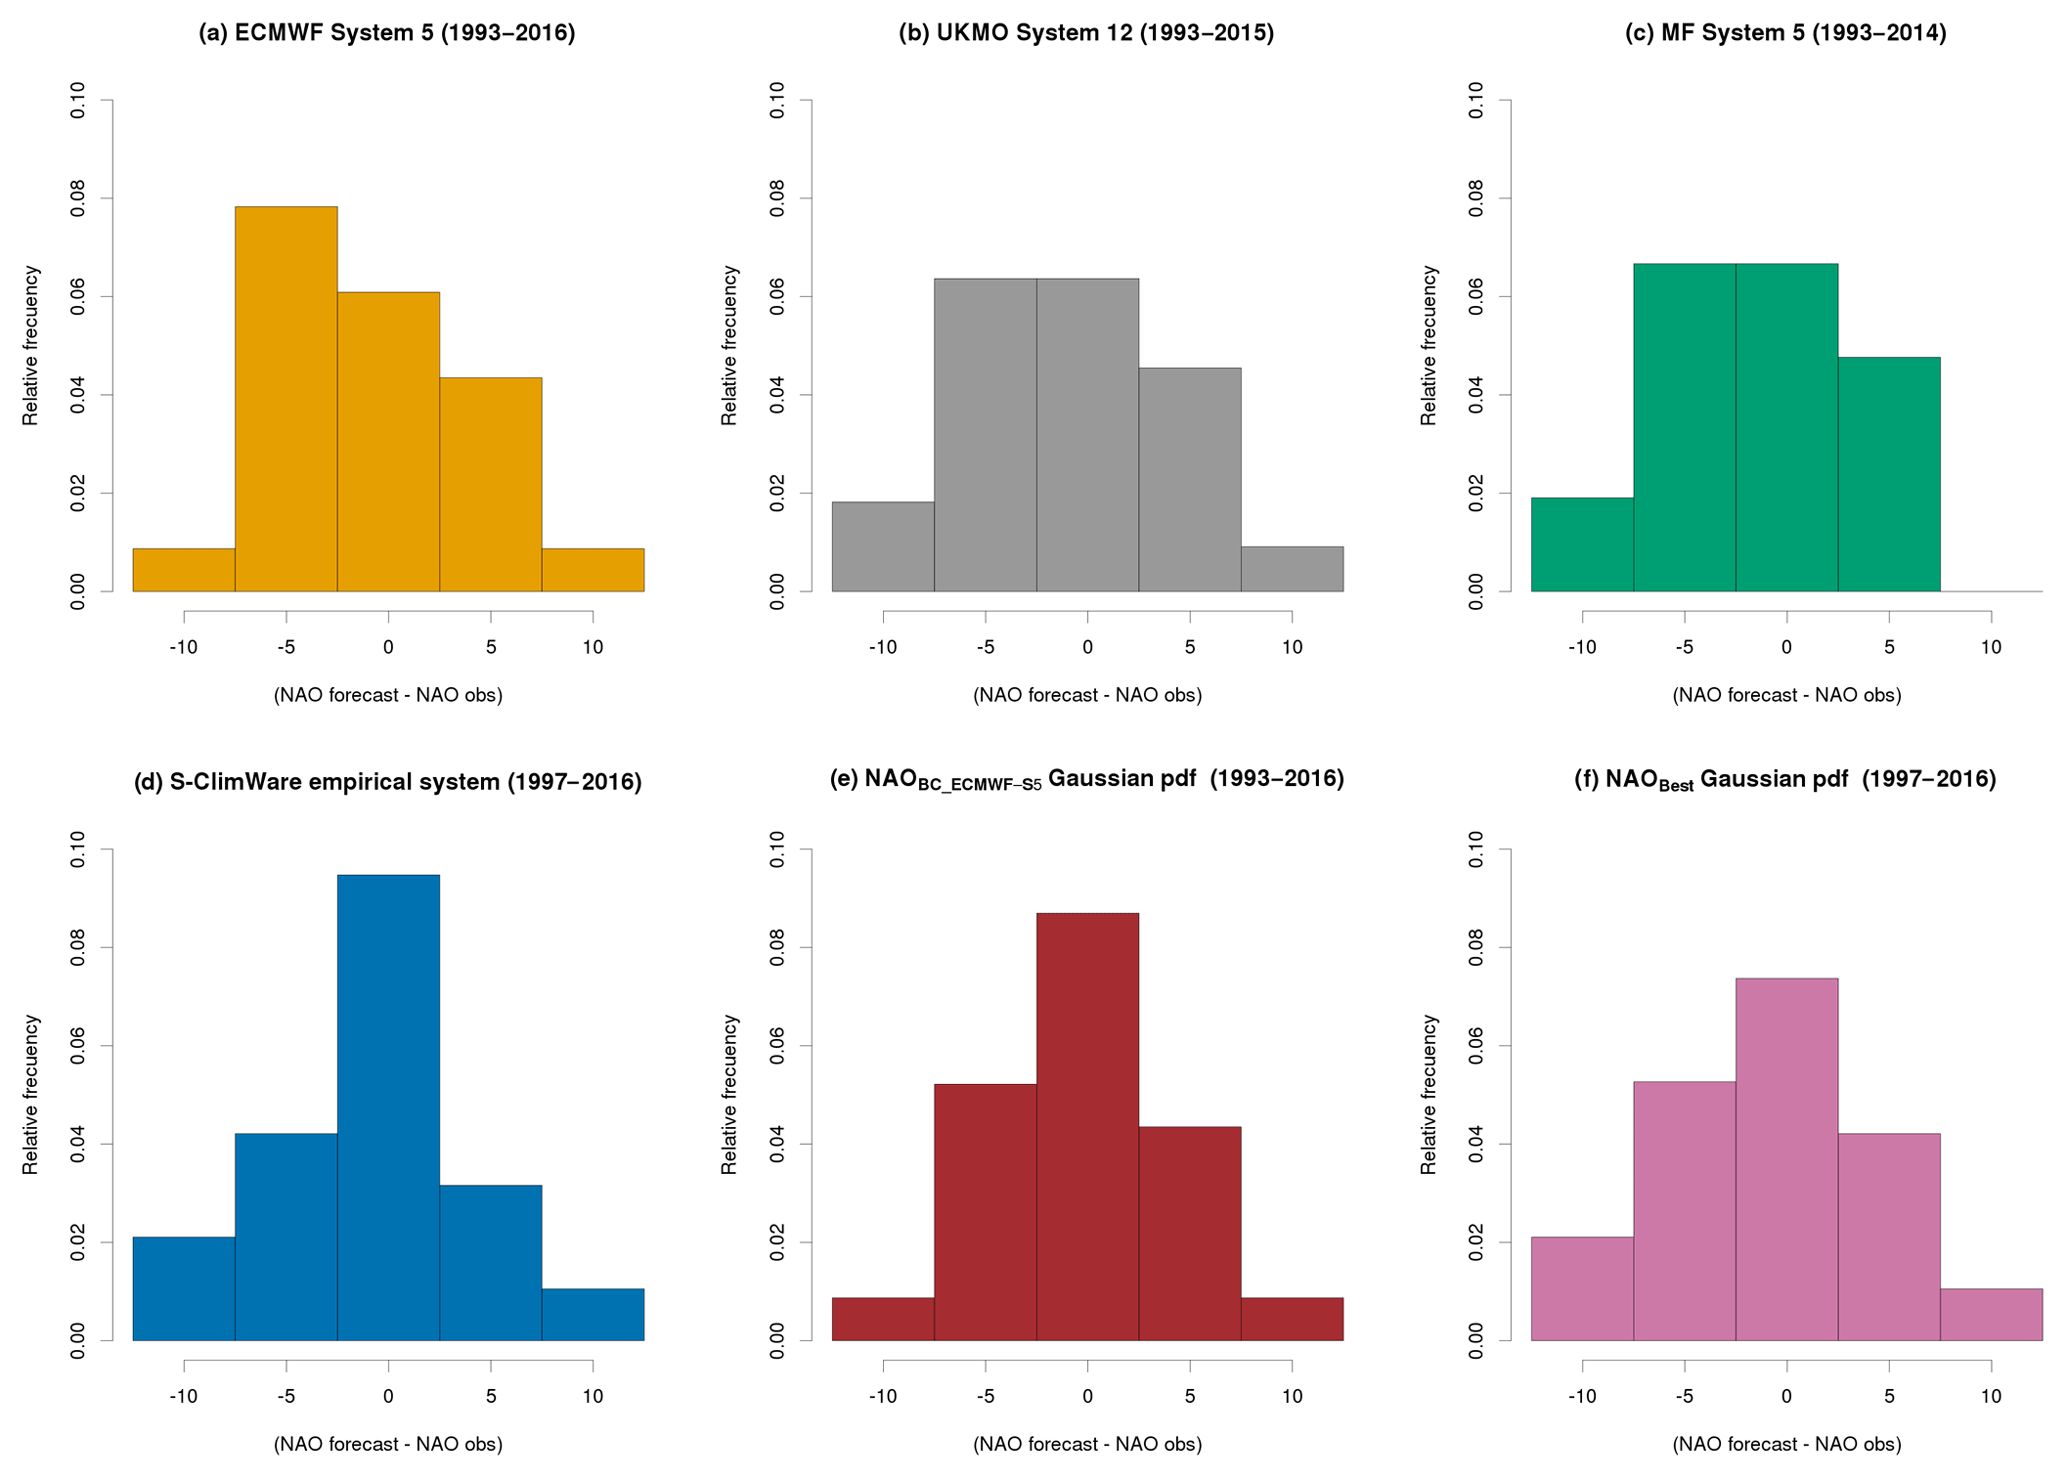
Figure 2Error histograms of ensemble mean of NAO [DJF] index forecasted by different seasonal forecasting systems/methodologies initialized with October data: (a) ECMWF System 5; (b) UKMO System 12; (c) MF System 5; (d) S-ClimWaRe empirical system; (e) bias corrected ECMWF System 5 Gaussian pdf and (f) Best NAO estimate Gaussian pdf. NAO [DJF] index from the ERA Interim reanalysis is used as the reference data to assess model performance. The available hindcast period used to calculate NAO [DJF] index error is indicated in parentheses. In all cases, the extreme negative NAO [DJF] index in year 2009/2010 has been excluded.
Histograms in Fig. 2a, b, c, d show distribution of ensemble mean NAO error for all studied SFSs over the available hindcast period for each system. All forecasting systems present biases (underestimation of NAO), being S-ClimWaRe empirical system the least biased. It is noticeable that error distribution of the S-ClimWaRe empirical system has the sharpest histogram and closest to a Gaussian pdf.
3.1 Correction of NAO index error and reduction of ECMWF S5 ensemble spread
ECMWF System 5 NAO presents the highest correlation with ERAI, but it is biased. Using results obtained above (see Fig. 1b), a bias correction has been performed to the ensemble mean of NAO index of this SFS. The bias correction scheme here proposed is based on a linear model using ensemble variance of NAO index as predictor. Taking this predictor in the bias correction algorithm means that negative biases of ensemble mean NAO are related to small NAO ensemble variances whereas the largest NAO ensemble variances are linked to positive biases of ensemble mean NAO. As it is shown in Fig. 1a, the magnitude of the ensemble mean of NAO index is underestimated. So, in case of large positive/negative observed NAO index (obtained from ERAI), ECMWF System 5 ensemble mean of NAO index generally presents a negative/positive bias that the bias correction scheme will partially correct according to Fig. 1b, because this bias is associated to a small/large NAO ensemble variance. The aim of this bias correction is to alleviate the underestimation of the ensemble mean of NAO index. It can be applied because ECMWF System 5 is providing information about the sign of biases through the magnitude of the NAO index ensemble variance. In other words, it seems that, in case of a positive/negative NAO index forecast the SFS NAO ensemble variance tends to be smaller/larger.
The coefficient of the predictor of the bias correction regression is trained separately for each year in the hindcast period. This is done by leaving out the current year NAO index error and using a data sample with the remaining years.
Figure 2e depicts the errors histogram of the ECMWF System 5 ensemble mean of NAO index after the bias correction procedure. We call NAOBC_ECMWF-S5_mean to this ensemble mean of NAO index after the bias correction. A much sharper and less biased errors distribution is obtained as compared to Fig. 2a. The corrected winter NAO time series still presents a high correlation with ERAI, being only slightly lower than that of the uncorrected ensemble mean of NAO index with ERAI (see columns 2–3 of Table 2).
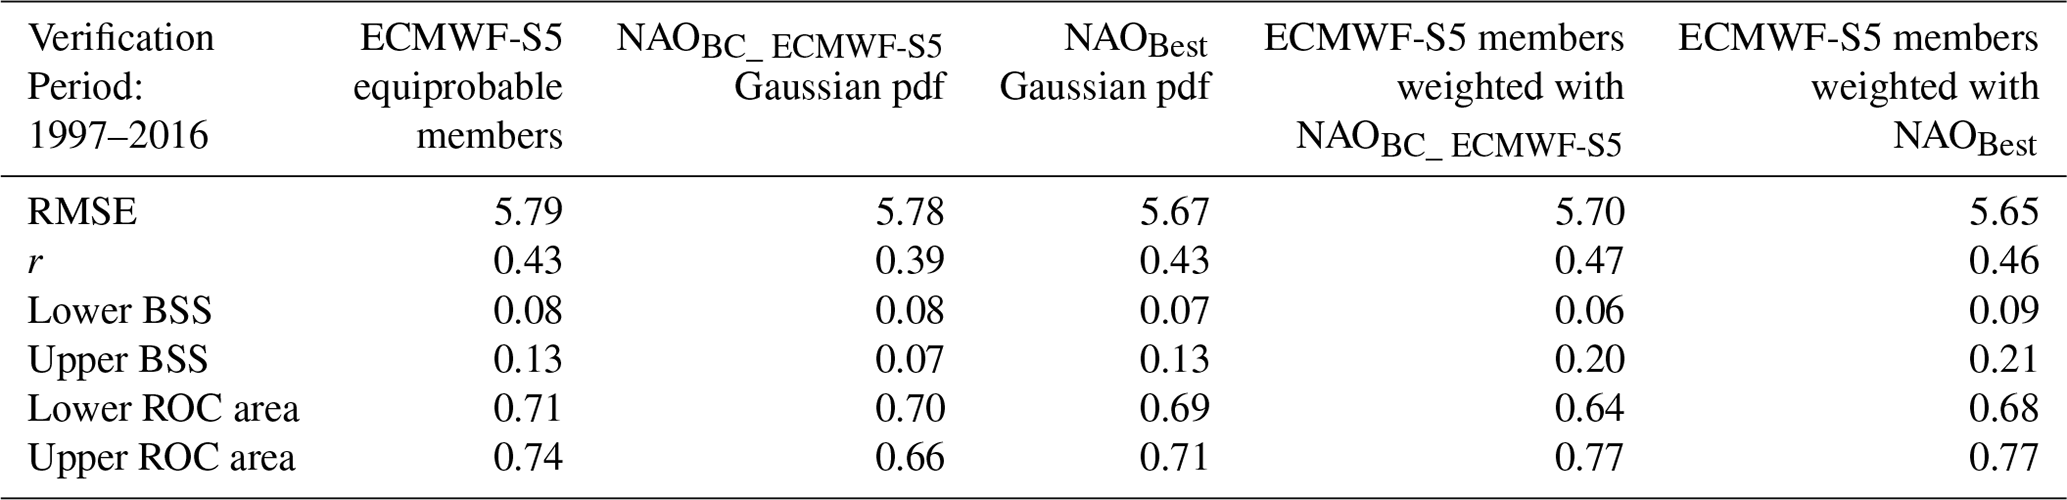
Table 2Verification scores for the ensemble mean and the pdf of winter index NAO [DJF] forecasts by: ECMWF System-5 with equiprobable ensemble members, Bias Corrected ECMWF System 5 Gaussian pdf (NAOBC_ECMWF-S5), Best NAO Gaussian pdf (NAOBest), ECMWF System 5 with ensemble members weighted using NAOBC_ ECMWF-S5, and ECMWF System 5 with ensemble members weighted using NAOBest. ERAI derived NAO indices are used as observations. The list of indicators displayed in the different rows are: Root Mean Square Error (RMSE) of the ensemble mean of NAO index or mean of Gaussian pdf, correlation coefficient (r) of the ensemble mean of NAO index or mean of Gaussian pdf against ERAI NAO index, Brier Skill Score for NAO index anomalies below the lower tercile (Lower BSS), Brier Skill Score Brier Skill Score for NAO index anomalies above the upper tercile (Upper BSS), Relative Operating Characteristic area for NAO index anomalies below the lower tercile (Lower ROC area), and Relative Operating Characteristic area for NAO index anomalies above the upper tercile (Upper ROC area).
A Gaussian model centred in the corrected NAO value, NAOBC_ECMWF-S5= N (NAOBC_ECMWF-S5_mean, σBC_ECMWF-S5), has been finally adopted to represent every year the NAO errors probability density function. The error standard deviation of the bias corrected NAO index provides the width of this Gaussian pdf, σBC_ECMWF-S5. A similar procedure to the one used to train the bias coefficient each year is employed to calculate σBC_ECMWF-S5. An example of the Gaussian NAO pdf for the winter 2012–2013 is displayed in red in Fig. 3.
3.2 Optimal estimation of the NAO pdf
The first step of the methodology presented in this paper ends with the optimal estimation of the winter NAO. Two a priori NAO estimates are considered in this work. The first one is the ECMWF System 5 bias corrected NAO index with Gaussian errors distribution described in Sect. 3.1 (NAOBC_ECMWF-S5= N (NAOBC_ECMWF-S5_ mean, σBC_ ECMWF-S5)). The second a priori estimate of winter NAO index comes from S-ClimWaRe empirical prediction (NAOS-ClimWaRe). We call NAOS-ClimWaRe_fc to the NAO index forecasted empirically each year. The S-ClimWaRe NAO index errors pdf is represented similarly to those of ECMWF System 5 bias corrected NAO, with a normal distribution using RMSE of the empirical NAO index forecasts as the standard deviation σS-ClimWaRe. So, NAOS-ClimWaRe= N (NAOS-ClimWaRe_fc, σS-ClimWaRe).
These two a priori NAO estimates with Gaussian errors pdfs present significant correlation with ERAI (see Tables 1 and 2). Application of statistical estimation theory provides the optimal estimation of winter NAO index and its uncertainty. According to Kalnay (2003), the “Best” estimate of the truth, that minimizes the error variance and maximizes the a posteriori probability in a Bayesian approach, is a sharper Gaussian pdf, NAOBest= N (NAOBest_mean, σBest). This optimal estimate will be unbiased if the two a priori estimates are.
The mean of this Best NAO Gaussian pdf estimate, NAOBest_mean, is obtained by linear combination of the ECMWF System 5 bias corrected ensemble mean of NAO index, NAOBC_ECMWF-S5_mean, and the S-ClimWaRe NAO index empirical forecast,
Being the optimal coefficients aBC_ECMWF-S5 and aS-ClimWaRe dependent on the relative errors of each estimate:
The NAO optimal estimate has a reduced error standard deviation σBest:
Figure 3 shows NAOBC_ECMWF-S5 (red), NAOS-ClimWaRe (green), and NAOBest (blue) Gaussian pdfs obtained for the 2012–2013 winter. Figure 2f displays the errors histogram for the mean of this Best NAO Gaussian estimate, NAOBest, that is sharper and considerably less biased that the raw ECMWF System 5 ensemble mean one (Fig. 2a).

Figure 3Adjusted Gaussian pdf representing the forecasted NAO [DJF] index distribution for winter 2012–2013 by: (i) the bias corrected ECMWF System 5 (red), (ii) S-ClimWare empirical system (green), and (iii) the a posteriori Best NAO estimate (blue).
In Table 2 some deterministic (RMSE, correlation coefficient with ERAI) verification scores of the raw uncorrected ECMWF System 5 ensemble mean of the NAO index, the mean of bias corrected ECMWF NAO Gaussian pdf (NAOBC_ECMWF-S5), and the mean of the Best NAO Gaussian pdf estimate (NAOBest) are displayed. RMSE is slightly reduced and correlation with ERAI is maintained in the Best NAO Gaussian estimate. Probabilistic verification scores for the NAO pdf forecast by the same systems are also provided in Table 2: Brier Skill Score (BSS), and Relative Operating Characteristic (ROC) area for NAO index anomalies below/above the lower/upper tercile (Wilks, 2006). In short, the Relative Operating Characteristic ROC area can be considered a summary of the performance of a probabilistic forecasting system with respect to its ability to discriminate the occurrence or not of a certain event (e.g. to be below the lower tercile). Notice that an upper/lower tercile event corresponds to a positive/negative NAO. BSS measures the relative skill of the forecast of a certain event compared to the climatology, in relation to reliability and resolution of the probabilistic forecast. In general, a ROC/BSS score above 0.5∕0.0 indicates skill better than climatological probabilities. Columns 2–4 of Table 2 show marginal prediction skill for both positive and negative phases of NAO by probabilistic forecasts of the three systems. Spread/RMSE ratio has been also obtained for the Best NAO Gaussian pdf estimate (NAOBest) and shows to be close to 1 (0.94).
This section presents the results obtained in the second step of the methodology here proposed. The outcome compares the use of the two obtained Gaussian functions representing enhanced NAO pdf forecasts to weight ECMWF System 5 ensemble members. These two Gaussian functions correspond to NAOBC_ECMWF-S5, the bias corrected ECMWF System 5 NAO pdf described in Sect. 3.1, and to NAOBest, the Best NAO pdf obtained in Sect. 3.2, respectively. Extended winter (NDJFM) is the season considered for precipitation and hindcast period covers 1997 to 2016. For each year of the hindcast period, these two Gaussian weighting functions have been obtained leaving the current year NAO index errors predicted by ECMWF System 5 and S-ClimWaRe out in the procedure to calculate the bias correction coefficient and NAO index error standard deviation or RMSE values employed as width of the a priori Gaussian estimates. Notice that in an operational context, weights assigned to ensemble members each year of the hindcast period are not static. They must be re-initialized when additional information on NAO forecast errors of the past winter becomes available in order to better train bias correction coefficient and NAO index RMSE values. This implies that also SFS climatology might change due to the update of the member's weighting function for each year of the hindcast period. Member's weighting of the seasonal forecast initialized in October for the next winter would also benefit of longer hindcast period and then time series of NAO forecast errors.
The outcome of the ensemble member's weighting has been assessed using gridded observational precipitation from E-OBSv16 dataset (Cornes et al., 2018) over the Iberian Peninsula. Figure 4 shows a selection of the verification scores employed: anomaly correlation coefficient (ACC) of the ensemble mean precipitation, and Relative Operating Characteristic area for precipitation anomalies above/below the upper/lower terciles (upper ROC area/lower ROC area). They have been computed for the extended winter forecasted precipitation using three strategies for ECMSF S5 ensemble: equally weighted members, weighted members with the bias corrected NAO Gaussian pdf (NAOBC_ECMWF-S5) and weighted members using the Best NAO pdf estimate (NAOBest). ACC provides skill information of the SFS deterministic precipitation forecast. Relative Operating Characteristic (ROC) area score has been used to assess the performance of the SFS probabilistic precipitation forecasts. Maps in Fig. 4 show that the procedure for the bias correction of ECMWF System 5 and adoption of a Gaussian NAO pdf here described and its application for weighting ensemble members produces an improvement over the precipitation pdf based on equally weighted members. Both deterministic (for ensemble mean) and probabilistic scores demonstrate the benefit obtained. The prediction skill is further enhanced by applying the Best NAO pdf estimate for member's weighting.
The effect of ECMWF System 5 ensemble member's weighting on winter NAO index forecasts has been also assessed. Corresponding verification scores are displayed in the last two columns of Table 2. Ensemble members weighting with NAOBC_ECMWF-S5 and NAOBest decrease RMSE of the ensemble mean of NAO index with respect to consider equiprobable members (see column 2 of Table 2). The usage of NAOBest as weighting function decreases RMSE of the ensemble mean of NAO index the most. Correlation of the ensemble mean of NAO index with that derived from ERAI also increases by ensemble member's weighting. Verification scores for probabilistic forecasts of NAO index presented in Table 2 show a clear improvement in case of NAO index anomalies in the upper tercile (positive NAO) when ensemble members are weighted with the two NAO Gaussian pdfs forecasts. Again the usage of NAOBest produces the larger forecast skill improvement. So, the methodology proposed consistently enhance both winter NAO prediction, and precipitation forecasts over the Iberian Peninsula.
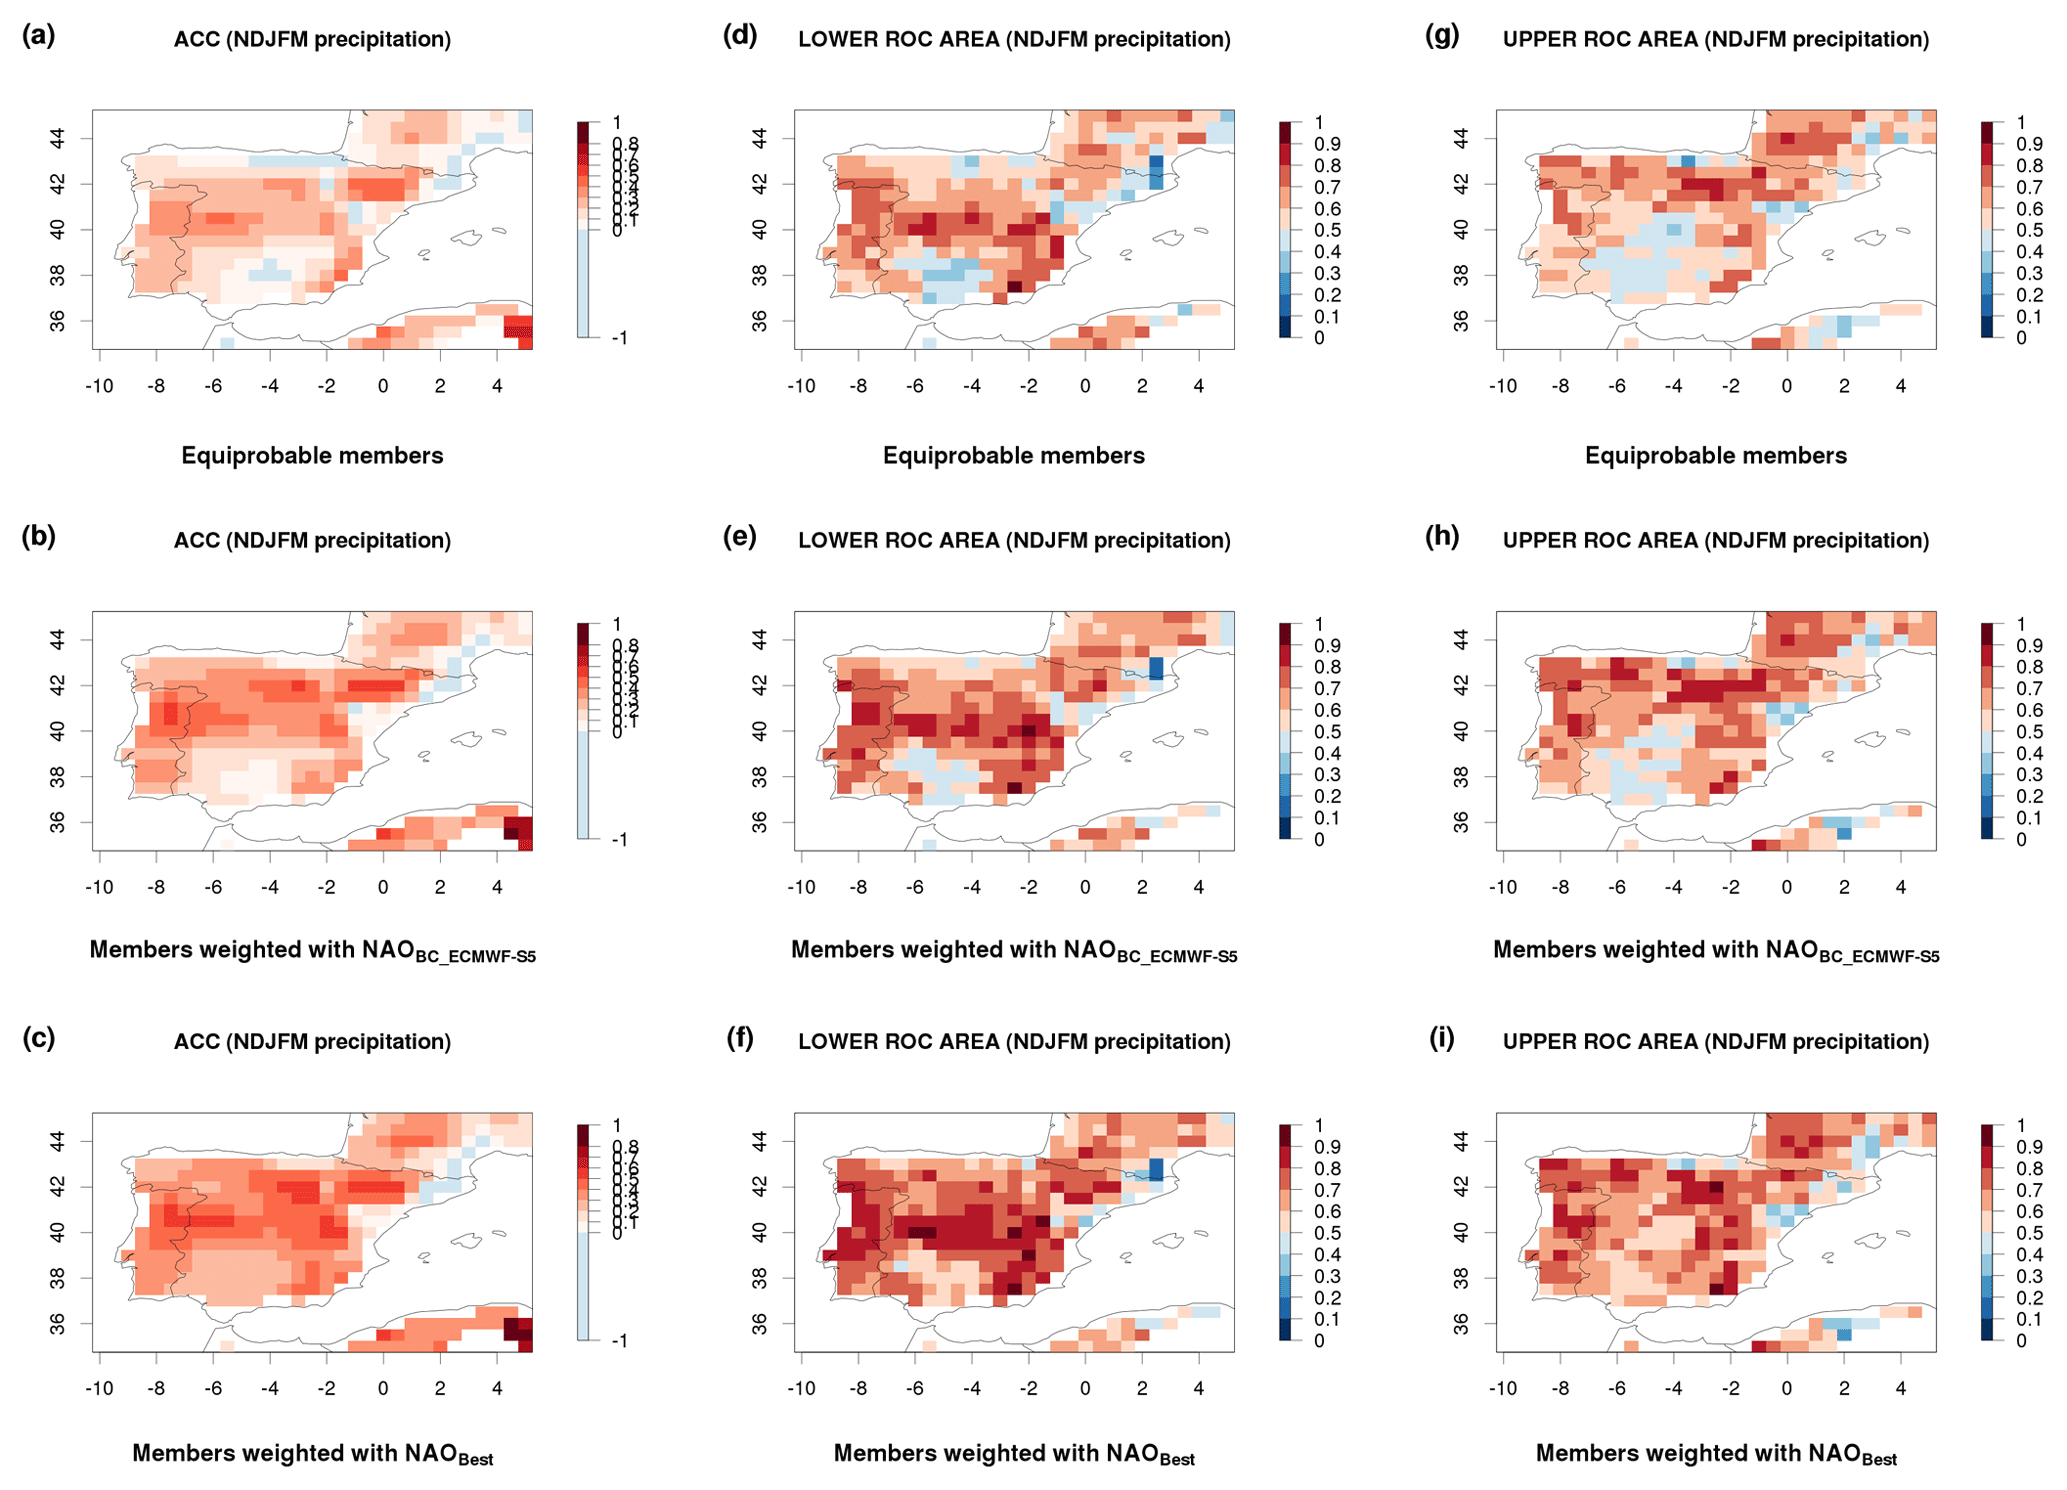
Figure 4Anomaly correlation coefficient (a, b, c), lower ROC area (d, e, f) and upper ROC area (g, h, i) for seasonal forecasts of total precipitation (from November to March, initialized with October data) corresponding to ECMWF System 5 with: equally weighted ensemble members (a, d, g), weighted members with the bias corrected ECMWF System 5 NAO Gaussian pdf NAOBC_ECMWF-S5 (b, e, h) and weighted members using the Best NAO Gaussian pdf estimate NAOBest (c, f, i). Seasonal forecasts are verified against the gridded E-OBS observational database. The hindcast period covers 1997–2016. The number of ECMWF System 5 ensemble members for the hindcast period is 25.
We have described a methodology for ensemble member's weighting of operational seasonal forecasting systems based on an enhanced prediction of a driver of climate variability strongly affecting certain climate variables (e.g. temperature, precipitation) over a certain region. We have applied it to the North Atlantic Oscillation influence on the Iberian Peninsula winter precipitation.
The first step of our approach consists in obtaining an improved NAO index forecast. Error statistics features of forecasted NAO pattern by different SFSs have been analysed. Winter NAO index forecasted by a skilful empirical system based on a teleconnection with snow cover advance and with Gaussian errors distribution has been considered as an a priori NAO pdf estimate. Using as background the ECMWF System 5 ensemble mean of NAO index, a new a priori estimate for the pdf of NAO index encompassing a bias correction procedure and a Gaussian model for distribution of errors has been proposed. The two a priori estimates have been optimally combined to obtain an enhanced a posteriori NAO index pdf. These new NAO estimates result to be less biased and slightly improved, in terms of verification scores, to those of ECMWF System 5.
The second step of the proposed methodology is to employ the enhanced NAO index estimates for ensemble member's weighting of a SFS based on a single dynamical model. The new NAO pdfs obtained in this work have been employed to improve the ECMWF System 5 NAO index prediction and precipitation forecast skill over the Iberian Peninsula. Verification results confirm that an accurate forecast for winter NAO distribution is key to make skilful forecasts of precipitation over this region. We show noticeable improvement of winter precipitation forecasts over our region of interest when members are weighted using a NAO index Gaussian pdf based on ECMWF System 5 bias corrected errors as compared with the usual approach based on equiprobability of ensemble members. Skill of forecasted precipitation is further enhanced by weighting ensemble members making use of the Best NAO pdf estimate based on a combination of the Gaussian pdf from ECMWF System 5 and a skilful empirical relationship with near normally distributed errors. The assessment of the effect of member's weighting on ECMWF System 5 NAO index forecasts confirm that they are consistently improved with the methodology employed.
Although this procedure has been applied to the ECMWF System 5, the approach is fully general and consequently applicable to any other dynamical SFS providing a skilful NAO signal, as long as their errors are properly characterised. This work has made use of an empirical seasonal forecasting system to add new information to ECMWF System 5 forecasts, but any other SFS showing enough good performance regarding forecasted NAO might be employed. It should stressed that this method relies on a proper errors characterisation and therefore a longer hindcast period is always highly desirable. Additionally a longer hindcast period allows a more robust testing of the statistical methods described and analyzed in this work. As it has been shown by Kang et al. (2014) and other authors, the skill of AO or NAO forecasts by different SFS depends on the reforecast period considered.
The ERA Interim reanalysis data and the three operational C3S SFSs (ECMWF System 5, Met Office S12 and Météo France S5) data are available at Copernicus Climate Change Service (C3S) (https://cds.climate.copernicus.eu, Climate Data Store, 2019). The E-OBS observational data are available at European Climate Assessment & Dataset project (2019, https://www.ecad.eu/download/ensembles/download.php), implemented by ECA&D project team (Cornes et al., 2018, https://doi.org/10.1029/2017JD028200).
The S-ClimWaRe empirical model data can be requested from the authors.
ERC conceived the idea. BN developed the method of combination and weighting. ESG implemented the method and performed the analysis and assesment. JV provided the data from empirical model.
The authors declare that they have no conflict of interest.
This article is part of the special issue “18th EMS Annual Meeting: European Conference for Applied Meteorology and Climatology 2018”. It is a result of the EMS Annual Meeting: European Conference for Applied Meteorology and Climatology 2018, Budapest, Hungary, 3–7 September 2018.
The authors very much appreciate two anonymous reviewers for their valuable comments and suggestions that have helped to significantly improve the description of this work.
The research leading to these results has received funding from MEDSCOPE project. MEDSCOPE is co-funded by the European Commission as part of ERA4CS, an ERA-NET initiated by JPI Climate, grant agreement no. 690462.
This paper was edited by Silvio Gualdi and reviewed by two anonymous referees.
Athanasiadis, P. J., Bellucci, A., Scaife, A., Hermanson, L., Meteria, S., Sanna, A., Borrelli, A., MacLachlan, C., and Gualdi, S.: A Multisystem View of Wintertime NAO Seasonal Predictions, J. Climate, 30, 1461–1475, https://doi.org/10.1175/JCLI-D-16-0153.1, 2017.
Butler, A. H., Arribas, A., Athanassiadou, M., Baehr, J., Calvo, N., Charlton-Perez, A., Déqué, A., Domeisen, D. I. V., Fröhlich, K., Hendon, H., Imada, Y., Ishii, M., Iza, M., Karpechko, A. Yu., Kumar, A., MacLachlan, C., Merryfield, W. J., Müller, W. A., O'Neill, A., Scaife, A. A., Scinocca, J., Sigmond, M., Stockdale, T. N., and Yasuda, T.: The Climate-system Historical Forecast Project: do stratosphere-resolving models make better seasonal climate predictions in boreal winter?, Q. J. Roy. Meteor. Soc., 142, 1413–1427, https://doi.org/10.1002/qj.2743, 2016.
Climate Data Store: https://cds.climate.copernicus.eu, last access: 8 August 2019.
Coelho, C. A. S. and Pezzulli, S.: Forecast Calibration and Combination: A Simple Bayesian Approach for ENSO, J. Climate, 17, 1504–1516, https://doi.org/10.1175/1520-0442(2004)017<1504:FCACAS>2.0.CO;2, 2004.
Cohen, J. and Jones, J.: A new index for more accurate winter predictions, Geophys. Res. Lett., 38, L21701, https://doi.org/10.1029/2011GL049626, 2011.
Cornes, R., van der Schrier, G., van den Besselaar, E. J. M., and Jones, P. D.: An Ensemble Version of the E-OBS Temperature and Precipitation Datasets, J. Geophys. Res.-Atmos., 123, 9391–9409, https://doi.org/10.1029/2017JD028200, 2018.
Dee, D. P., Uppala, S. M., Simmons, A. J., Berrisford, P., Poli, P., Kobayashi, S., Andrae, U., Balmaseda, M. A., Balsamo, G., Bauer, P., Bechtold, P., Beljaars, A. C. M., van de Berg, L., Bidlot, J., Bormann, N., Delsol, C., Dragani, R., Fuentes, M., Geer, A. J., Haimberger, L., Healy, S. B., Hersbach, H., Hólm, E. V., Isaksen, L., Kållberg, P., Köhler, M., Matricardi, M., McNally, A. P., Monge‐Sanz, B. M., Morcrette, J.-J., Park, B.-K., Peubey, C., de Rosnay, P., Tavolato, C., Thépaut, J.-N., and Vitart, F.: The ERA-Interim reanalysis: configuration and performance of the data assimilation system, Q. J. Roy. Meteor. Soc., 137, 553–597, https://doi.org/10.1002/qj.828, 2011.
Dobrynin, M., Domeisen, D. I. V., Müller, W. A., Bell, L., Brune, S., Bunzel, F., Düsterhus, A., Fröhlich, K., Pohlmann, H., and Baehr, J.: Improved Teleconnection-Based Dynamical Seasonal Predictions of Boreal Winter, Geophys. Res. Lett., 45, 3605–3614, https://doi.org/10.1002/2018GL077209, 2018.
European Climate Assessment & Dataset project: E-OBS gridded dataset, available at: https://www.ecad.eu/download/ensembles/download.php, last access: 8 August 2019.
Eyre, J. R.: Observation Bias correction schemes in data assimilation systems: a theoretical study of some of some of their properties, Q. J. Roy. Meteor. Soc., 142, 2284–2291, https://doi.org/10.1002/qj.2819, 2016.
Helfrich, S. R., McNamara, D., Ramsay, B. H., Baldwin, T., and Kasheta, T.: Enhancements to, and forthcoming developments in the Interactive Multisensor Snow and Ice Mapping System (IMS), Hydrol. Process., 21, 1576–1586, https://doi.org/10.1002/hyp.6720, 2007.
Kalnay, E.: Atmospheric modelling, Data Assimilation and Predictability, Cambridge University Press, New York, 2003.
Kang, D., Lee, M.-I., Im, J., Kim, D., Kim, H.-M., Kang, H.-S., Schubert, S. D., Arribas, A., and MacLachlan, C.: Prediction of the Arctic Oscillation in boreal winter by dynamical seasonal forecasting systems, Geophys. Res. Lett., 41, 3577–3585, https://doi.org/10.1002/2014GL060011, 2014.
Ramsay, B. H.: The interactive multisensory snow and ice mapping system, Hydrol. Process., 12, 1537–1546, https://doi.org/10.1002/(SICI)1099-1085(199808/09)12:10/11<1537::AID-HYP679>3.0.CO;2-A, 1998.
Riddle, E. E., Butler, A. H., Furtado, J. C., Cohen, J. L., and Kumar, A.: CFSv2 ensemble prediction of the wintertime Arctic Oscillation, Clim. Dynam., 41, 1099–1116, https://doi.org/10.1007/s00382-013-1850-5, 2013.
Rodríguez-Puebla, C., Encinas, A. H., Nieto, S., and Garmendia, J.: Spatial and temporal patterns of annual precipitation variability over the Iberian peninsula, Int. J. Climatol., 18, 299–316, https://doi.org/10.1002/(SICI)1097-0088(19980315)18:3<299::AID-JOC247>3.0.CO;2-L, 1998.
Scaife, A. A., Arribas, A., Blockley, E., Brookshaw, A., Clark, R. T., Dunstone, N., Eade, R., Fereday, D., Folland, C. K., Gordon, M., Hermanson, L., Knight, J. R., Lea, D. J., MacLachlan, C., Maidens, A., Martin, M., Peterson, A. K., Smith, D., Vellinga, M., Wallace, E., Waters, J., and Williams, A.: Skillful long-range prediction of European and North American winters, Geophys. Res. Lett., 41, 2514–2519, https://doi.org/10.1002/2014GL059637, 2014.
Stockdale, T. N., Molteni, F., and Ferranti, L.: Atmospheric initial conditions and the predictability of the Arctic Oscillation, Geophys. Res. Lett., 42, 1173–1179, https://doi.org/10.1002/2014GL062681, 2015.
Voces, J., Sánchez-García, E., Navascués, B., Franco, F., and Rodríguez-Camino, E.: Sistema estadístico de predicción estacional para la gestión de los embalses en España, Nota Técnica no. 21 AEMET, http://hdl.handle.net/20.500.11765/4431 (last access: 6 August 2019), 2016.
Wilks, D. S.: Statistical methods in the atmospheric sciences, 2nd edition, Academic Press, USA, 2006.
- Abstract
- Introduction
- Errors of seasonal forecasting systems predicting the winter NAO
- Methodology to improve the NAO estimate
- Improved precipitation by ensemble member's weighting with enhanced NAO pdf forecast estimates
- Summary and final remarks
- Data availability
- Author contributions
- Competing interests
- Special issue statement
- Acknowledgements
- Financial support
- Review statement
- References